Macro Overview
Fed rate decisions, economic data, sector rotation, and broad market trend analysis — stay on top of macro shifts and catch the market's big-picture direction.
22 articles
Bloom Energy: The Fuel Cell Stock Behind the AI Power Boom
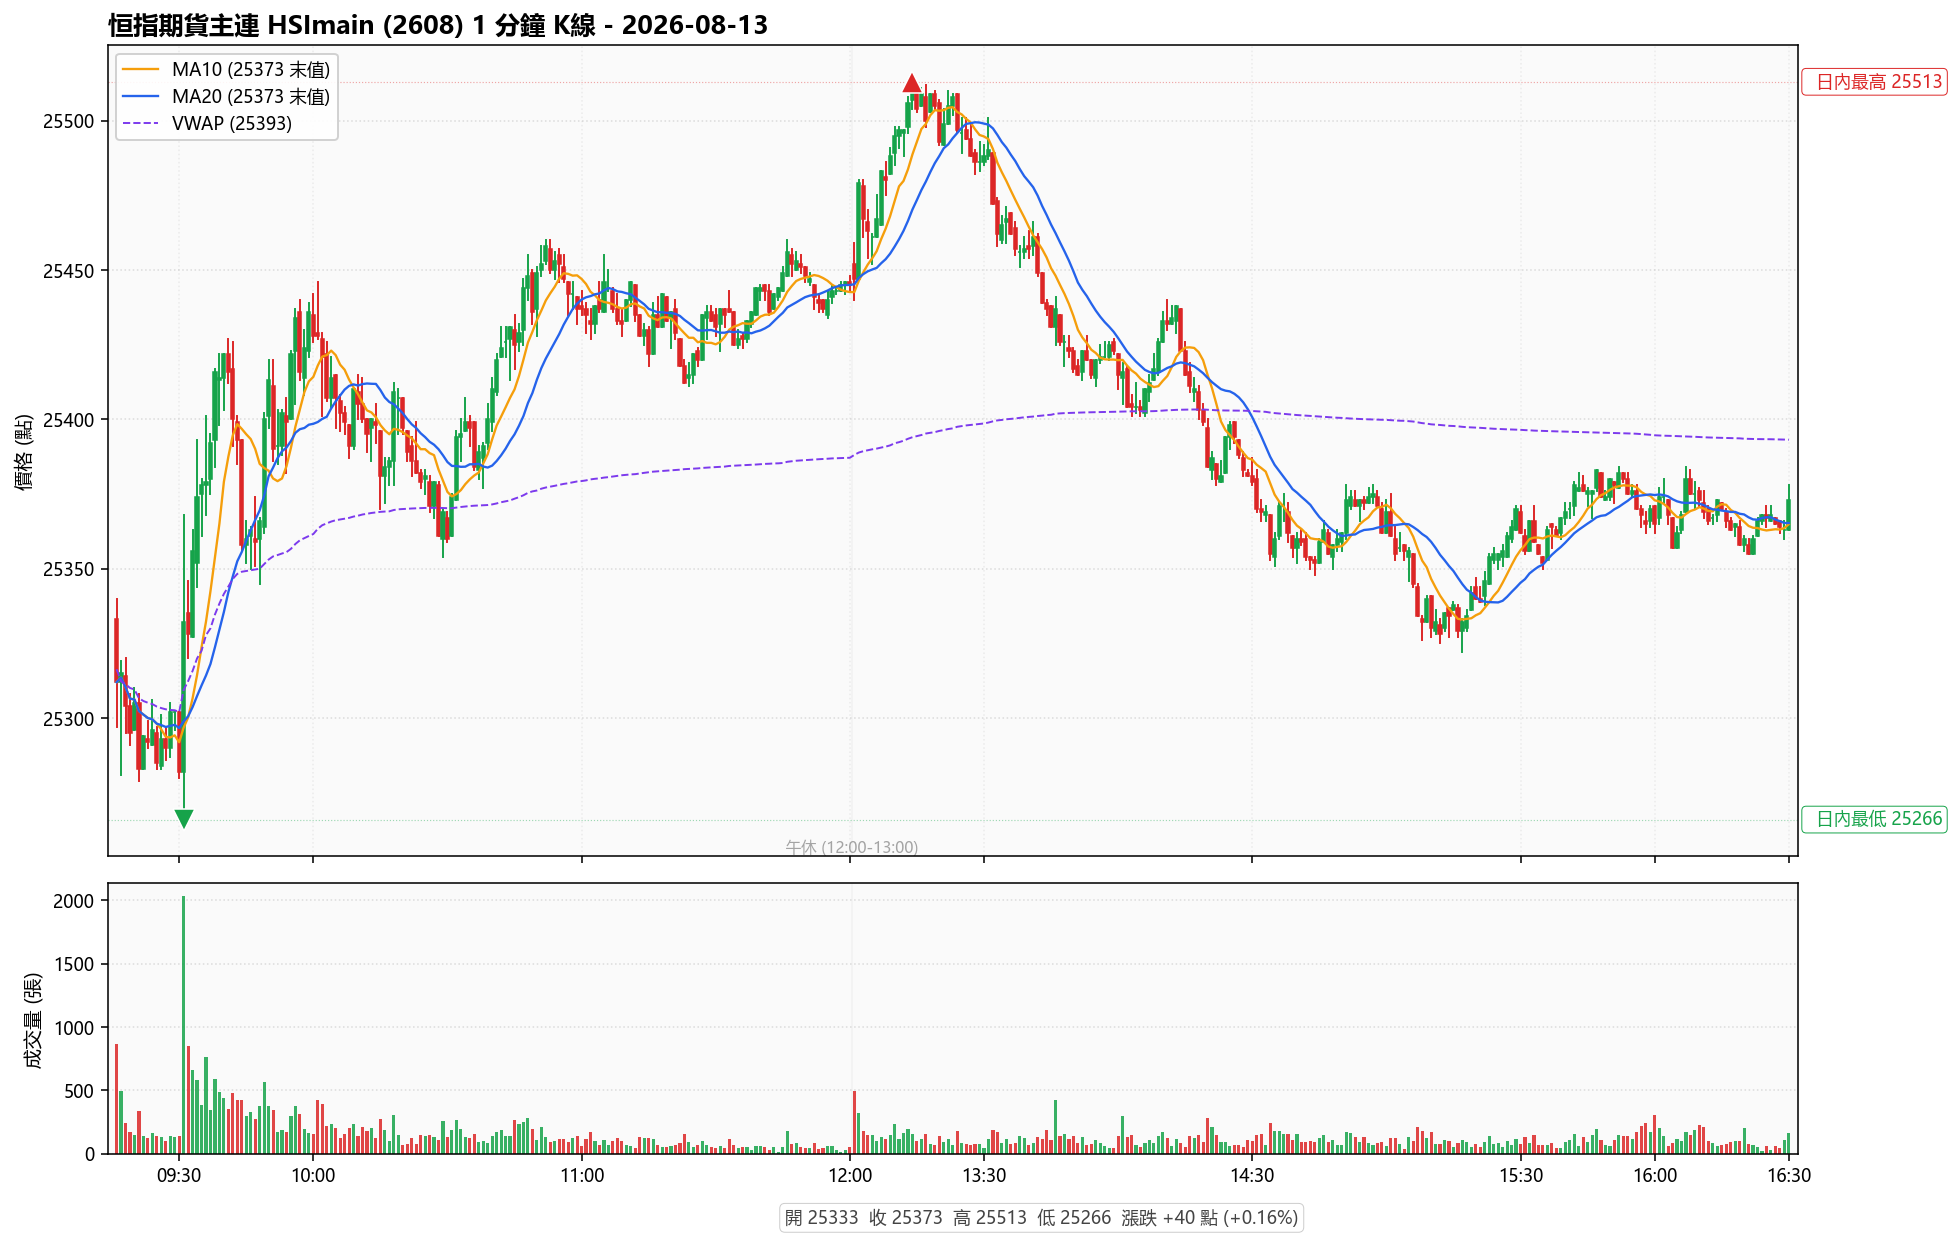
Hang Seng Index Futures 2026-08-13 Closing Analysis: Inverted V in the Morning, Inverted V Reversal in the Afternoon
The HSImain front-month futures opened at 25,333 and closed at 25,373 yesterday, with a full-day trading range of 247 points. The morning session bottomed at 25,266 at 09:31 before staging a sharp rebound, while the afternoon touched the day's high of 25,513 at 13:14, followed by an inverted-V pullback. The late session staged a V-shaped recovery, finishing up 40 points. The article analyzes four key intraday turning points, the resistance and support zones, and the volume-price characteristics.
Mag7 7-Day Sentiment vs Price: Who Diverged? (2026-08-10)
A 7-day comparison of news sentiment and price action for TSLA, MSFT, NVDA, GOOG, AMZN, AAPL, META, revealing clear divergences between AAPL and GOOG against the broader AI-driven rally.

US Stocks Weekly Outlook: Inflation Data & AI Earnings Set the Tone
The US stock market faces a dual catalyst week from August 11–14, 2026, as July CPI, PPI, retail sales, and jobless claims collide with marquee earnings from SMCI, Cisco, Applied Materials, JD.com, and the broader AI hardware chain. Nasdaq and S&P 500 direction hinges on the tug-of-war between sticky inflation and AI-led growth.
US Stock Daily Brief | August 6, 2026
US stocks closed mixed on Wednesday as the market digested Tuesday's rally. Thursday's calendar is light ahead of Friday's nonfarm payrolls. Key focus: NVDA breakout, GOOG AI setback, AppLovin earnings miss, and Tesla Friday OPEX amid crowded long positioning.
News Sentiment vs Price Divergence: Mega-Cap Tech in 7 Days (2026-08-06)
Using US Stock VIP MCP's 11,205 US-stock messages plus Discord-monitored closing quotes from 07/31 to 08/05, we map daily news sentiment and close-price moves for TSLA, MSFT, NVDA, GOOG, AMZN, AAPL, META, and flag the divergence days.

US-Japan Joint FX Intervention: USD/JPY Flash Crash and Carry Trade Unwind Risk
USD/JPY plunged from 164 to 157 as Japan deployed $52.8B and the US Treasury joined by selling euros to buy yen — its first yen intervention since 1998. This piece breaks down the carry trade mechanism, the rationale behind the coordinated action, and the contagion path to Nasdaq, Tesla and other risk assets if a mass unwind repeats.

30-Year US Treasury Yield Hits New High: What It Means for US Stocks
The 30-Year US Treasury yield has surged past 5% in early August 2026, hitting multi-year highs. This article breaks down the historical context, transmission mechanisms, sector impact, and actionable positioning advice for equity investors facing a structurally higher long-end rate environment.
US Stocks August Super Cycle: Megacap Earnings & Macro Calendar (2026-08-02)
A comprehensive breakdown of late-July Mag 7 earnings (MSFT, AMZN, AAPL, META) and the critical August macro lineup including Nonfarm Payrolls, CPI, FOMC minutes, Jackson Hole, and NVIDIA's Q2 report, with quantified upside/downside scenarios for the S&P 500 and tech valuations.

US Premarket Macro Brief|June CPI Cools, Fed Decides Tonight, Yield Curve Still Flat (2026-07-28)
June US CPI YoY eased to 3.5% (from 4.2%) as the US-Iran ceasefire cooled energy prices, snapping a five-month reacceleration streak. Core PCE YoY still runs at 3.4%, well above the Fed's 2% target. The FOMC begins its July 28-29 meeting today, with Fed Funds futures pricing a near-certain hold. 10Y-2Y spread sits at +36bp—positive but razor-thin. Verdict: Neutral-toward-cautious; macro tail risks dominate.

US Stocks Daily Brief — July 28, 2026 (2026-07-28)
Today's focus: Thursday's FOMC and Friday's PCE; gold hits fresh all-time high, USD under pressure, Tesla weekly options expiry amplifies volatility; watch policy, FX, geopolitical and valuation risks.
美股宏觀週報|科技巨頭財報放榜、聯準會即將開會(2026-07-25)
本週美股迎來 Magnificent 7 財報密集放榜:Alphabet、Amazon、Meta、Microsoft 上週同步公布 Q2 2026 業績,營收與 EPS 普遍優於市場預期,AI 資本支出再上修;Apple 於 7/30 收盤後接力、NVIDIA 則於 8/26 揭曉。宏觀方面,6 月 CPI 年增降至 3.5%、6 月非農僅新增 5.7 萬人、失業率 4.2%,聯邦基金利率維持 3.5–3.75%。下週 FOMC(7/28–29)將是市場下一個關鍵轉折點。

錢流熱板塊與RS強勢美股篩選:板塊輪動解讀與十大跑贏大盤個股清單 (2026-07-24)
當前油價破百、地緣升溫疊加AI資本支出爭議,資金在晶片、能源、國防與防禦板塊之間劇烈輪動。本文以SPY為基準,拆解七個強勢板塊與兩個弱勢板塊的資金邏輯,並依RS多週期、市值流動性、均線趨勢與基本面四道硬性條件,篩出十檔跑贏大盤且具備可操作性的強勢美股清單。

How FOMC and Central Bank Decisions Impact the US Stock Market
FOMC meetings are among the biggest risk events in global financial markets. This article breaks down how three key catalysts — the rate decision, the dot plot, and the press conference — drive moves in US equities, and how traders should approach "FOMC Day".
Nasdaq 100 Trend Analysis: Is There Still Upside for Tech Stocks?
An in-depth analysis of the recent performance of the Nasdaq 100 Index, combining macroeconomic data and technical indicators to explore the outlook for tech stocks.

How to Read the P/E Ratio: One Metric to See Through Valuation
The P/E ratio is one of the most commonly used valuation metrics, but many people use it incorrectly. This article teaches you how to properly understand and apply the P/E ratio.
What Impact Does Triple Witching Day Have on US Stocks? What Investors Need to Watch Out For
Triple Witching is one of the biggest volatility catalysts in the U.S. stock market each quarter. This article breaks down the mechanics of Triple Witching, its real impact on stock prices, how market maker gamma hedging amplifies volatility, and how retail investors should respond.

AI Infrastructure Investment Map: Breaking Down the Opportunities and Risks of the Six-Layer Physical Infrastructure Stack
A bottom-up breakdown of the six-layer AI Infrastructure framework — spanning manufacturing equipment, chips, memory, networking optics, cloud infrastructure, and power — analyzing each layer's business logic, valuation positioning, and risk points to help you build a complete investment map of the AI infrastructure stack.

Federal Reserve Dot Plot Explained: The Forward-Looking Map Every US Stock and Gold Trader Must See
is an anonymous forecast map of future interest rates produced by the 19 FOMC decision-makers, published four times a year. It serves as the most authoritative forward-looking indicator for US equities, gold, and the bond market. The article begins with the structure of the Dot Plot and how to read it, then examines the gap between its signals and market expectations, breaks down how it influences US equity sectors, gold, and currencies, and closes with a practical action checklist.
Fed Rate-Cut Anniversary: Key Asset Reallocation Strategy
Since the Federal Reserve launched its rate-cut cycle in July 2025, the federal funds rate has fallen from 4.33% to 3.63%, a cumulative cut of 70 basis points. However, with inflation reaccelerating in 2026 and the CPI year-over-year rate rebounding to 3.53%, long-end Treasury yields have moved inversely higher to 4.13%. This article analyzes asset reallocation opportunities and risks under the rate-cut environment through four data dimensions: interest rates, inflation, employment, and REITs.
Page 1 / 2, 22 articles