Hang Seng Index Futures 2026-08-13 Closing Analysis: Inverted V in the Morning, Inverted V Reversal in the Afternoon
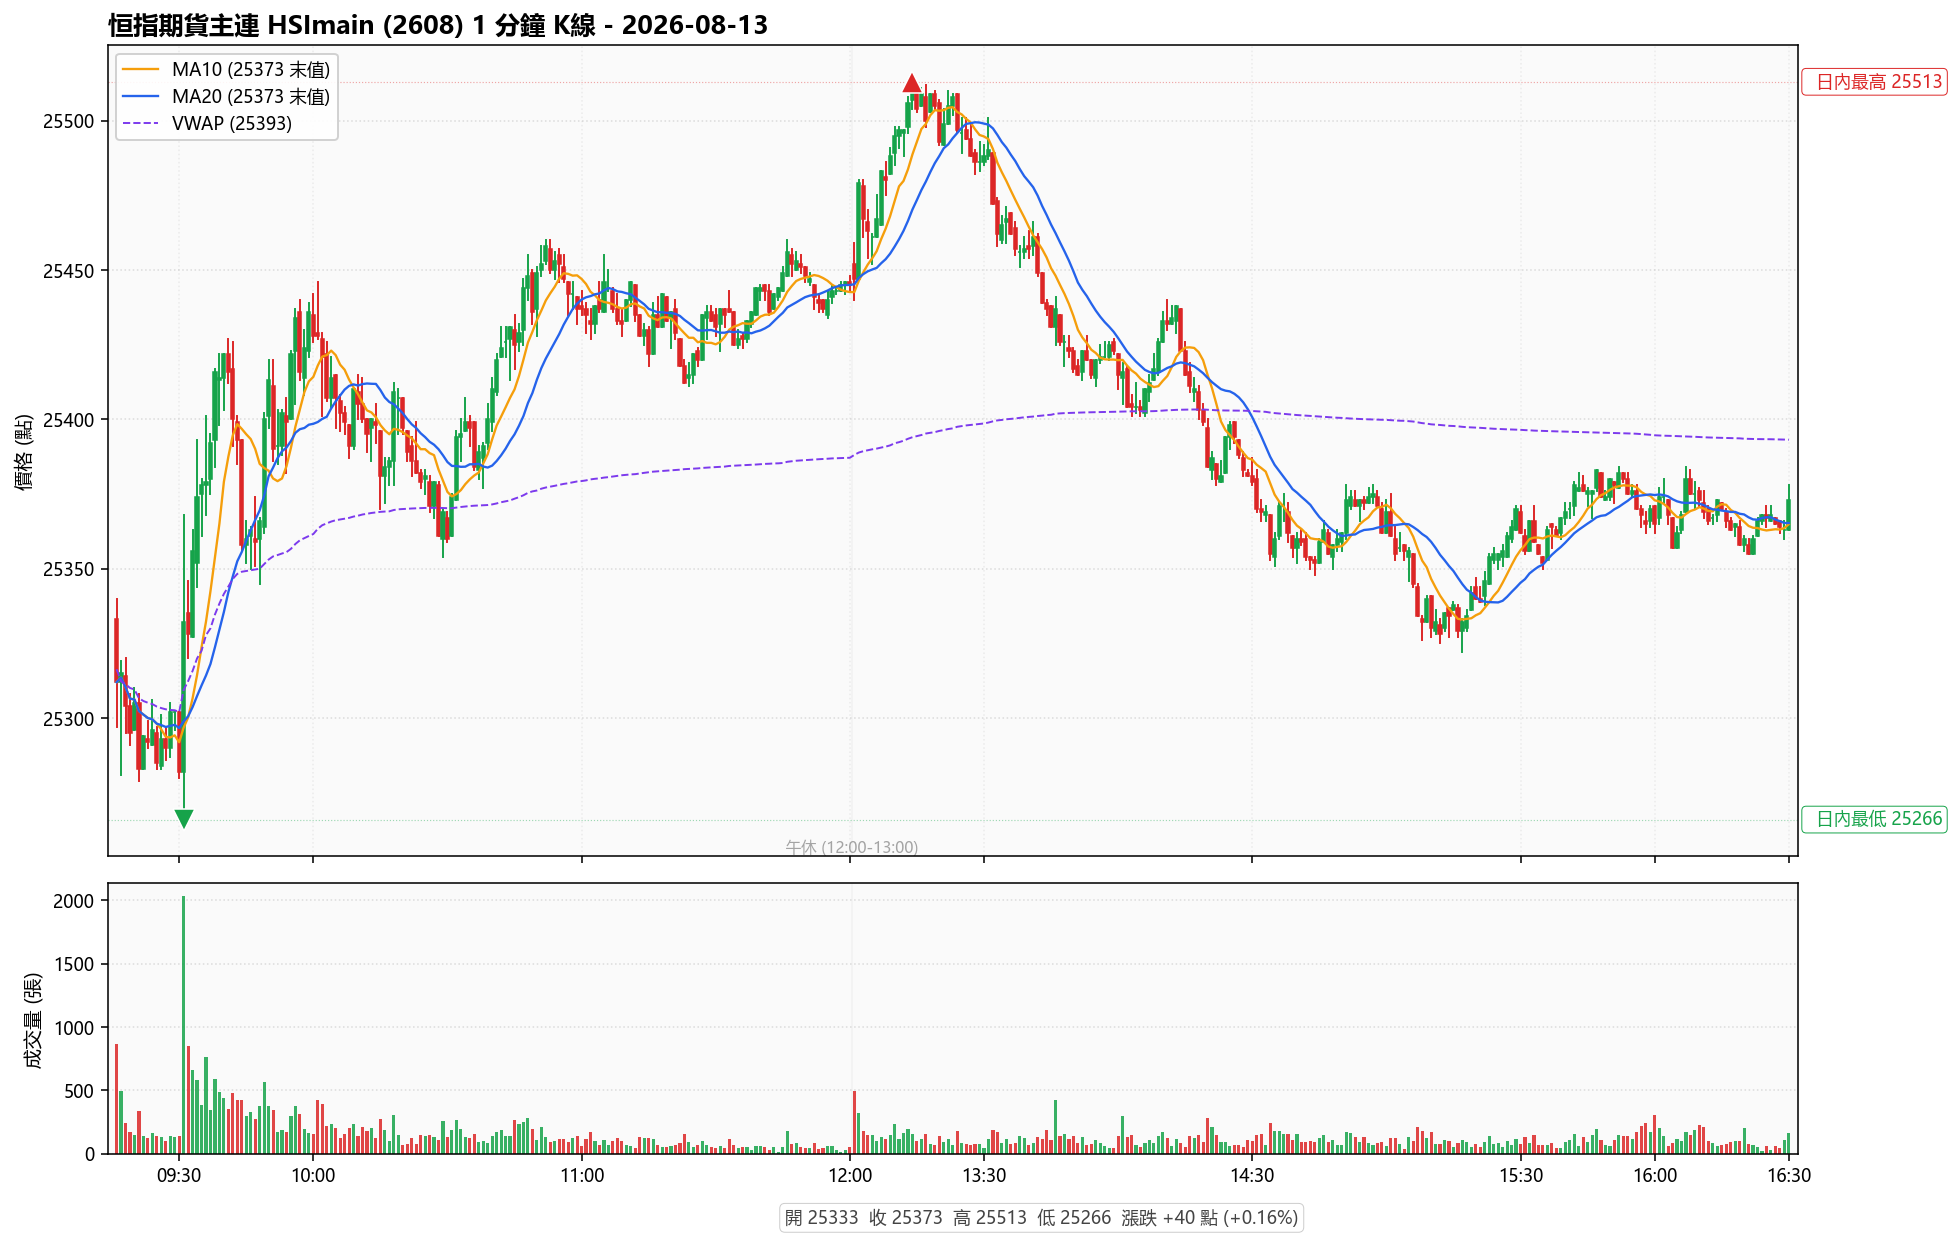
The HSImain front-month futures opened at 25,333 and closed at 25,373 yesterday, with a full-day trading range of 247 points. The morning session bottomed at 25,266 at 09:31 before staging a sharp rebound, while the afternoon touched the day's high of 25,513 at 13:14, followed by an inverted-V pullback. The late session staged a V-shaped recovery, finishing up 40 points. The article analyzes four key intraday turning points, the resistance and support zones, and the volume-price characteristics.
Hang Seng Index Futures 2026-08-13 Close Analysis: Early-Session Inverted V, Afternoon Inverted-V Reversal, Red Day Slightly Up
I. Opening Session Overview
The Hang Seng Index Futures main contract (HSImain 2608) opened yesterday at 25,333 points, 13 points above the previous day's settlement of 25,320. Riding the positive overnight momentum from US equities, buying interest briefly surged at the open, but was immediately met with profit-taking selling pressure. Prices began pulling back from 09:20, hitting the session low of 25,266 at 09:31, with intraday losses reaching as much as 67 points at one stage.
The 09:31 candle recorded the day's largest 1-minute volume (2,032 contracts), clearly a "long lower-shadow bottom-fishing" signal formed by stop-loss orders and counter-trend buying hitting the market simultaneously. Buyers immediately took control, with prices rebounding sharply from 25,266. In just ten minutes from 09:35 to 09:45, prices climbed steadily, breaking above 25,400 by 09:38; around 10:20, prices oscillated in a high-side range of 25,440–25,460.
The final 5-minute candle before the lunch break (12:00) closed at 25,445, 112 points above the open (+0.44%). The full early session (09:16–12:00) comprised 165 one-minute candles with total volume of 31,309 contracts and turnover of approximately HK$794.8 million, already accounting for 55.8% of the entire day — underscoring how the first half hour sets the tone for the entire session.
II. Key Intraday Turning Points
First Turning Point: 09:31 Early-Session V-Shaped Reversal
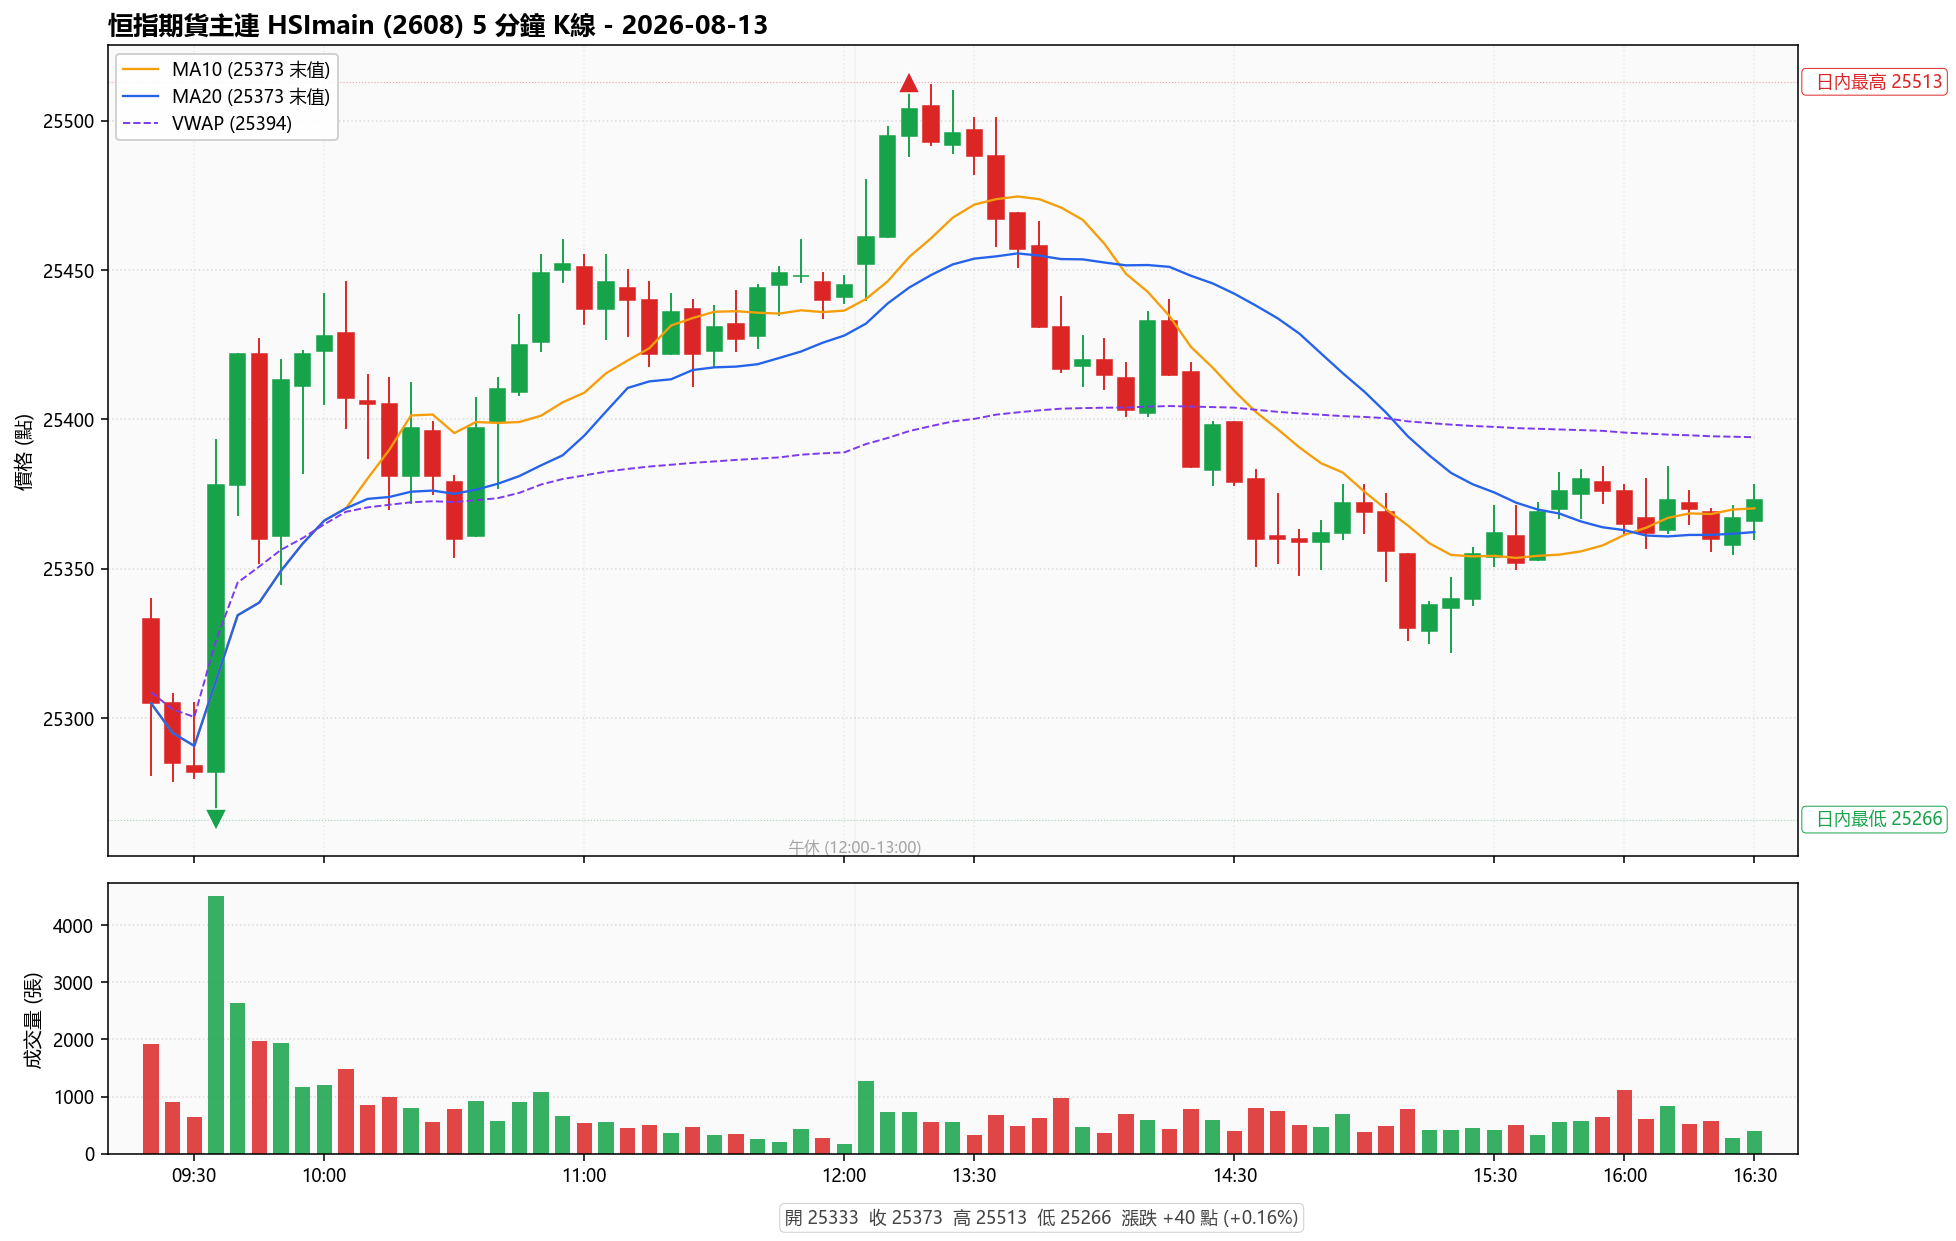
The 1-minute chart shows that 09:31 printed an "extremely long lower shadow" pattern (high-low range of 102 points, 2,032 contracts traded), immediately followed by five consecutive bullish candles breaking upward. Combined with the 09:35 5-minute candle recording a single-bar volume of 4,505 contracts (the day's largest 5-minute volume), this confirmed that the early-session bottom was established.
Second Turning Point: 13:14 Afternoon Spike-and-Fade
After the lunch break resumed, 1-minute candles from 13:01–13:02 showed consecutive volume expansion (13:02 traded 318 contracts, with prices breaking above 25,480), and market sentiment turned momentarily euphoric. After touching the day's high of 25,513 at 13:14, five consecutive bearish candles appeared, and the 13:20 5-minute candle ultimately closed at 25,493. At this point, more than half of the cumulative intraday gain of 247 points (from the early low of 25,266) had been given back.
Third Turning Point: 14:45–15:15 Secondary Test of Lows
After pulling back from the afternoon highs, prices attempted a rebound to 25,433 between 14:00–14:25 but failed, weakening again after 14:30. The 14:45–15:15 window saw consecutive bearish candles, with prices touching the afternoon low of 25,329 at 15:15, representing a cumulative pullback of 184 points from the day's high.
Fourth Turning Point: 15:30 Late-Session Rebound
After touching 25,352 at 15:35, a series of small bullish candles appeared, with prices recovering above 25,370 after 16:00. The 16:30 closing price of 25,373 was 40 points above the open (+0.16%) and 44 points above the afternoon low, presenting a classic "intraday V-shaped recovery" pattern.
III. Support and Resistance Zones
Major Resistance Zones (Breakout requires strong catalyst)
- 25,510–25,513: The day's high zone. After being touched at 13:14, obvious selling emerged immediately, forming the strongest resistance band of the day.
- 25,480–25,495: Dense afternoon early-session trading zone. 5-minute candles closed at 25,495 at 13:10 and 25,504 at 13:15, with bulls and bears battling repeatedly here.
- 25,445–25,460: Early-session high and pre-lunch closing level, with multiple candles clustered together.
Major Support Zones (Buying intervention levels)
- 25,329–25,330: Absolute afternoon low. A single bullish candle appeared at 15:15, followed immediately by buying support.
- 25,266–25,280: Session low zone. After being touched at 09:31, an explosive-volume reversal followed, making this a strong support band.
- 25,355–25,365: Final half-hour dense zone before close. Prices tested this level repeatedly without breaking.
In terms of moving averages, both MA10 and MA20 closed at 25,373, with both lines showing a "converging and flattening" pattern in the late session, suggesting short-term momentum is trending toward balance and the directional choice is being left to the next trading session.
IV. Volume Characteristics
Total Day Volume: 56,077 contracts, Total Turnover approximately HK$1.424 billion.
- Early-session concentrated volume: The 09:16–09:45 half-hour window saw approximately 14,500 contracts traded, accounting for 25.9% of the day; of this, the 09:35 5-minute candle alone traded 4,505 contracts (8.0% of the day).
- Afternoon declining volume: The 13:05 5-minute candle traded 1,279 contracts, the highest single-bar volume of the afternoon; subsequent 5-minute volumes gradually declined to the 332–680 contract range.
- Volume-price divergence signal: The 5-minute volume corresponding to the afternoon high of 25,513 was only approximately 720 contracts, significantly lower than the 4,505 contracts during the early-session rebound to 25,420, forming a "price up, volume down" divergence — this is the main reason the afternoon failed to break above the early-session high.
- Closing-session volume contraction and stabilization: After 15:45, volumes generally fell back below 100 contracts, with price ranges narrowing to within 10 points, reflecting a strong wait-and-see atmosphere in the market.
The full-day VWAP closed at 25,393, 20 points above the closing price of 25,373, meaning the average position for those who "bought and held to close" was in slight loss. If prices fail to hold above VWAP going forward, technical selling pressure should be guarded against.
V. Short-Term Technical Outlook
From a 5-minute structure perspective, yesterday's price action presented a classic "double top + double bottom" pattern:
- Double top: 25,513 (13:14) and 25,460 (11:46) form a neckline at 25,445, which yesterday's close failed to break above.
- Double bottom: 25,266 (09:31) and 25,329 (15:15) form a short-term support band, and yesterday's close held above this support.
Key short-term levels:
- Upside breakout signal: If prices hold above 25,445 (MA10 and early-session high) within the first 30 minutes of today's open, the next target is the 25,495–25,513 resistance zone.
- Downside breach warning: If the afternoon low of 25,329 is broken, technicians will view it as a "double-bottom breakdown," with the next target being the session low of 25,266.
It is worth noting that Hang Seng Index Futures closed yesterday as a doji (intraday range of 247 points but close-to-open range of only 40 points), reflecting bulls and bears locked in a tug-of-war within the 25,300–25,500 range without a clear directional signal. Combined with overnight US equity performance and today's heavyweight economic data releases, short-term operations should focus on selling high and buying low within the range, with stops placed strictly 20 points beyond the upper and lower bounds of the range, avoiding heavy position entries while the direction remains unclear.
(All price, time, and volume data in this report come from real historical candlestick data of the HSImain contract on 2026-08-13 obtained via the Futu OpenAPI, provided for research reference only and does not constitute any investment advice; futures involve leverage and carry extreme risk, please make independent judgments and strictly control position size.)
⚠️ Disclaimer: This article is for educational purposes only and does not constitute investment advice. Investing involves risk.