Complete Guide to Gold Market Structure: HH/HL, BOS/MSS, Bollinger Bands, and Multi-Timeframe Analysis
A systematic breakdown of the core language of gold market structure: using HH/HL/LH/LL to identify trends, BOS/MSS to judge breakouts and reversals, Bollinger Bands to measure volatility, the layered application across four timeframes, and how candlestick patterns confirm entry timing.
Why Start with Market Structure?
Among all technical analysis tools, the most intuitive, reliable, and hardest to manipulate is Market Structure — using the price's own highs and lows to judge trend direction. This method requires no indicators, only your eyes.
Whether you trade 5-minute scalping, 15-minute swings, or 4-hour intraday moves, market structure is the foundational language. HH, HL, LH, and LL form the visual code of the market; BOS and MSS tell you whether the trend is continuing or reversing; Bollinger Bands quantify volatility; multiple timeframes provide decision-making hierarchy; and candlestick patterns serve as the final confirmation before entry.
This guide integrates all the above dimensions into a complete market structure analysis system to help you build the underlying logic of reading charts.
HH / HL: The Visual Language of an Uptrend
HH (Higher High) and HL (Higher Low) are the visual signatures of an uptrend. When price forms a "staircase pattern" — each low is successively higher, and each high keeps making new highs — the uptrend is confirmed.
"Got HH, then HL — at this moment I'm looking up."
This sentence encapsulates everything you need to know: when price makes a new high (HH) and each pullback forms a higher bottom (HL), the uptrend is established. Every HL pullback is a potential "trade with the trend" opportunity — provided it doesn't get broken. If an HL is broken, the uptrend may be ending and the market structure is shifting.
LH / LL: The Signature of a Downtrend
LH (Lower High) and LL (Lower Low) are the signatures of a downtrend.
"This is an LL — until I see HH, I won't BUY."
The meaning: without a higher high, the trend hasn't reversed, and sellers remain in control. In a downtrend, each bounce peaks lower (LH), and each decline carves out a deeper bottom (LL).
The Discipline of Waiting for Confirmation
The obsession with HH/HL shows itself in discipline:
"No, I just judge it by its HH and LL."
No insider information or magical indicators — the only thing to rely on is the price structure's highs and lows themselves. "Wait for HH confirmation" means: don't conclude the trend is established at the first high, but instead wait for price to form a second higher low (HL) before confirming the uptrend. This habit of waiting for confirmation is the key to avoiding false signals.
BOS: A Trend Continuation Signal
BOS (Break of Structure) occurs when price breaks an important structural point — such as a previous high or previous low. When a BOS happens, it often heralds strong trend continuation.
"BOS broke the external LL — chase the sell."
This is a common entry catchphrase: once an external Lower Low (lower than all previous lows) is broken, chase the short. The keys to BOS:
- It's a trend continuation signal, not a reversal
- Often followed by fast-moving price action
- Requires volume or momentum confirmation
The core use of BOS is to trade with the trend: when you've identified an uptrend (HH/HL), wait for the M15 pullback to end, then look for price to break the prior high and form a BOS — that's a good moment to go long with the trend.
MSS: A Structural Reversal Signal
MSS (Market Structure Shift) is a stronger signal, indicating a fundamental shift in market structure. Confirming an MSS usually requires several conditions:
- Price breaks a key structural level
- Accompanied by expanding volume
- A clear wick or candlestick pattern provides confirmation
| Dimension | BOS | MSS |
|---|---|---|
| Nature | Trend continuation | Trend reversal |
| Strength | Moderate | Strong |
| Where it appears | With the trend | Against the trend |
| Subsequent move | Accelerates in original direction | Large move in opposite direction |
| Confirmation elements | Structure break | Break + volume + pattern |
The biggest trap with MSS is the "fake MSS": price breaks the prior low then quickly snaps back — this could be a major-player shakeout. To avoid these traps, you need to combine the macro environment, market sentiment, and multi-timeframe analysis.
Bollinger Bands: A Volatility Quantification Tool
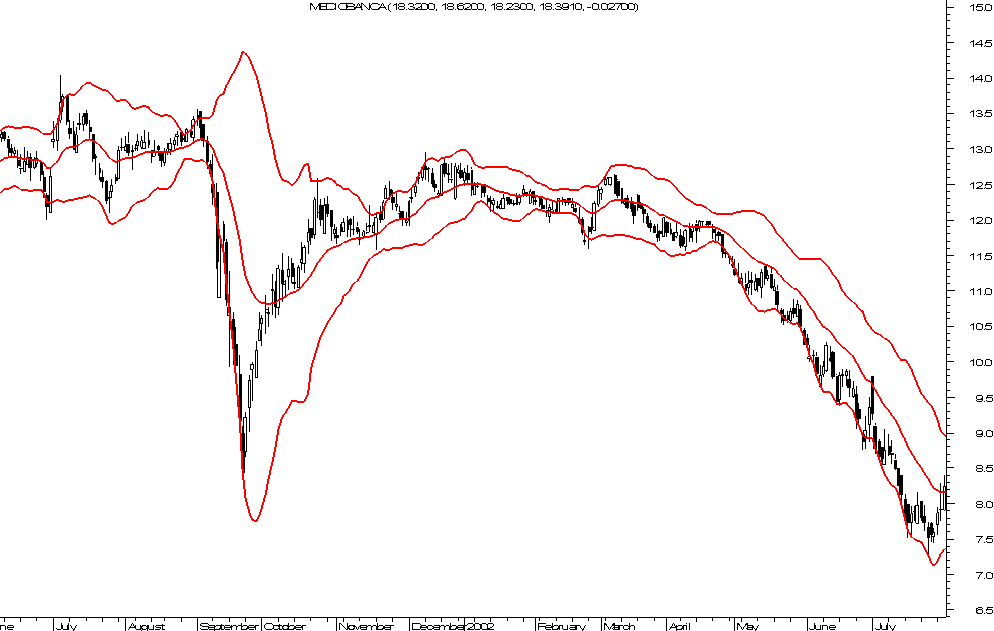
*Bollinger Bands chart of Italian stock MEDIOBANCA — the red bands clearly display the three-tier structure of upper / middle / lower rails.*
Bollinger Bands consist of three lines:
- Upper band: Middle band + 2 standard deviations
- Middle band: 20-period moving average (equivalent to MA20)
- Lower band: Middle band − 2 standard deviations
The middle band is itself a 20-period moving average, so Bollinger Bands have a natural relationship with the MA system. Bollinger Bands reflect the volatility of the past 20 candles — they cannot predict the future. Combine them with HH/HL structure and wick analysis to improve accuracy.
Common Uses of Bollinger Bands
BB squeeze = volatility contracting, a breakout is coming, often accompanied by fast one-directional moves. A squeeze is "the calm before the storm" — in a choppy market, when you see a BB squeeze, get ready for large moves.
BB expansion = volatility expanding, the trend accelerating — a good moment to enter with the trend. Expansion means the trend has already kicked off and is speeding up. Chase it with the trend, but set stops strictly.
M15 BB top means that on a 15-minute chart, price touches the upper Bollinger Band — a potential pullback signal. But beware: if it's only a pullback high within an uptrend (not a trend reversal), price may briefly touch the upper band and keep going up.
Trend Lines: Visualizing Direction
Newcomers often draw trend lines incorrectly. When drawing, note:
- Connect at least two clear lows (for an uptrend line) or two clear highs (for a downtrend line)
- "If it's too steep, don't trust it too much" — overly steep trend lines are unreliable
- A valid trend line should have at least three touch points; the more touches, the more reliable
- Price pulling back to a trend line is an entry opportunity, but wait for "no-break" confirmation
When price pulls back to a trend line and shows a wick rejection, an engulfing pattern, or other reversal signals, it's a good moment to go long with the trend (in an uptrend). Similarly, in a downtrend, when price bounces to a trend line and shows a top signal, that's a short opportunity.
Combined Application of Bollinger Bands and Trend Lines
Scenario 1: BB squeeze + trend-line touch
When the BB squeezes (volatility contracts) and price touches an uptrend line, this is often a "storm is coming" signal. Once price chooses a direction and breaks out, the move will be large.
Scenario 2: BB expansion + trend-line break
When the BB has already expanded (trend accelerating) and price breaks a trend line, this is often a "trend continuation" signal. This is the moment to chase with the trend, but set wider stops.
Scenario 3: BB middle band + trend-line cross
The BB middle band = 20MA. When the 20MA crosses a trend line, it often represents a tug-of-war between the short-term trend and the medium-term trend. Price behavior after the cross is key to determining direction.
Layered Use of Four Timeframes
In the world of gold trading, charts are your radar. Without solid chart analysis, you're like sailing through fog — at risk of hitting rocks at any moment.
D1 / W1: The Big Picture
The daily and weekly charts set the macro trend. This is the starting point for all analysis: if D1 is in an uptrend, then H4, M15, and M1 should only be looking for longs — don't short easily.
"Look at D1 first for the big direction — if the direction is wrong, everything after is wrong."
Trading against the D1 direction will eventually teach you a harsh lesson.
H4: The Swing Direction
The 4-hour chart defines the medium-term swing direction and is the foundation of trend-following. After confirming the trend on H4, wait for an M15 or H1 pullback to enter. H4's special value: it's more sensitive than D1 and can catch early shifts in trend; yet more stable than M15 and filters out short-term noise.
M15 / H1: Trend Confirmation
The 15-minute and 1-hour charts confirm trend direction and filter false signals. Don't see a small bullish candle on M1 and assume the trend has reversed — first check whether M15/H1 shows a structural change. This layer is your "entry map": you'll draw pullback zones here, set alerts, and size positions.
M1 / M5: Precise Entry Points
When all the higher-level analyses are satisfied, then look for specific entries on M1/M5.
"Trade with the big direction; enter against the small direction."
This sounds contradictory but is the essence of strategy: follow the D1/H4 big direction, and enter on the M15/M5 pullback of the smaller degree. "Against the small direction" means: when the big direction is up, wait for a small-degree drop, then buy when that small-degree drop ends.
Candlestick Patterns: Final Entry Confirmation
Candlestick patterns are the last filter for entry confirmation. Among the three pillars of technical analysis — structure, moving averages, and patterns — patterns are the closest to the entry action.
"Technical analysis isn't predicting the future; it's identifying the present."
Candlestick patterns tell you what's happening right now in the market: who's in control, the balance of bulls and bears, and whether price is being rejected at a certain level.
What Wicks Mean
- Long upper wick = price probed up then fell back = a sell signal = "upper wick, sell"
- Long lower wick = price probed down then bounced back = a buy signal = "lower wick, buy"
Wicks reveal the price levels that have been "rejected" — a true reflection of supply and demand.
The Art of Wick Rejection
"Wick rejection" means the wick closes inside the support/resistance level, indicating the level is valid and bulls and bears reach a temporary balance there. Why is rejection so important? Because it reveals the market's real supply and demand: price tried to break support, but at the close it returned above support — indicating genuine buying interest at that level.
"Wait for it to close a wick at the bottom of the wick, then chase the sell."
The ideal entry: price probes support, prints a lower wick, and the next candle confirms the reversal — only then consider going long with the trend.
Engulfing Patterns
Engulfing is one of the strongest reversal signals. The current candle completely engulfs the previous one, representing a dramatic shift in market sentiment. "A big engulfing" describes a strong reversal — the larger the engulfing, the more powerful the sentiment shift.
An engulfing only counts if it follows the first three steps of the playbook (trend break, pullback, no-break): the pattern must appear at a key support/resistance, and the larger the body, the stronger the reversal signal.
Priority of Entry Confirmation
When multiple entry signals appear at once, confirmation strength multiplies:
| Signal Combination | Confirmation Strength |
|---|---|
| Wick + key moving average + HH/HL structure | ⭐⭐⭐⭐⭐ |
| Engulfing + moving average + Fibonacci | ⭐⭐⭐⭐ |
| Pin Bar + MA confirmation | ⭐⭐⭐⭐ |
| Single wick or engulfing alone | ⭐⭐ (weak, better to wait) |
| Pure wick with no other confirmation | ⭐ (not recommended for entry) |
Common Pitfalls
1. Treating the First High as Trend Confirmation
A trend needs at least two highs and two lows to be confirmed. At the first high, nothing is settled yet.
2. Treating a Short-Term Bounce as an HH
In a downtrend, price may bounce to form what looks like a higher low, but it's not an HH. To judge whether a trend has truly reversed, you need to observe multiple timeframes.
3. Forcing HH/HL in a Choppy Market
In choppy markets, price's highs and lows repeatedly break, producing many "fake HH/HL." In choppy markets, range trading is more appropriate than trend-following.
4. Looking for Opportunity on the Wrong Timeframe
Looking for "trend" on a choppy M1 chart is like looking for an ocean in the desert. What you see as "trend" is just noise, not real market direction.
5. Treating Every Breakout as a BOS
Not every "break of prior high" is a BOS. If the breakout lacks volume confirmation, it may be a false breakout. In structural analysis, you must judge in the context of the overall pattern.
Complete Chart Checklist
Before every entry, you must complete the following ten checks:
- D1/W1 big direction = Is the trend up or down? Don't fight the trend.
- H4 swing direction = While aligning with D1, use H4 to confirm the swing direction.
- M15/H1 trend confirmation = At this layer, confirm whether the trend is still healthy.
- M1/M5 entry point = Find the precise entry location.
- HH/HL or LH/LL pattern = Is there a clear structural pattern?
- MA position and angle = Is price standing on the correct side? Are the MAs flattening or turning?
- Bollinger Band state = Is the BB squeezing? Is price touching the upper or lower band?
- Key support/resistance = Prior highs, prior lows, important round numbers.
- VIX level = Is VIX abnormal? What's the market sentiment?
- Today's major news times = Avoid holding positions before major news events.
Chapter Summary
The core of chart analysis is the three pillars: structure, moving averages, and patterns.
- Structure (HH/HL/LH/LL) tells you the direction of the trend
- Moving averages (MA) tell you the strength of the trend and support/resistance
- Patterns (wicks, engulfings) tell you the timing of entry
Combining these three — together with a read on the macro environment — forms a complete chart analysis system. Any one alone isn't enough; combine them, and you get a high-probability trading decision.
⚠️ Disclaimer: This article is for educational purposes only and does not constitute investment advice. Investing involves risk.
🎯 Quick Quiz
Finished reading? Test what you remember
Question 1/5
According to the article, what combination of structure points confirms an uptrend?
✗ Incorrect
Your answer:—
Correct answer:B. A Higher High (HH) followed by a Higher Low (HL)
💡 The article states: "Got HH, then HL — at this moment I'm looking up." The uptrend is only established when price makes a new high (HH) and each pullback then forms a higher bottom (HL).