Gold Pullback Entry System: The Four-Step Method, Fibonacci, and Pattern Confirmation
Condense trading decisions into four consecutive steps: trend break, pullback, hold, act. Provides an in-depth explanation of how to apply the 0.382, 0.5, 0.618, and 0.786 Fibonacci retracement levels, the confirmation mechanisms of wick rejections and engulfing patterns, and a complete entry decision tree.
Why Do You Need a Pullback Entry System?
Every beginner stepping into the world of gold trading should not hear about economic data or complex technical indicators as their first lesson. Instead, they should hear one short slogan:
Break the trend, Pullback, hold, enter.
These nine words distill years of real-trading experience into an entry philosophy. It is not a mechanical formula, but a sequence of thinking: first confirm the direction, then wait for a price pullback, and finally confirm that the support holds before officially committing. Every trade must pass these four checkpoints—missing even one is not acceptable.
"All the details come after the slogan."
Discipline first, details later—this is the fundamental philosophy of gold intraday trading.
Step One: Break the Trend
"Break the trend" does not simply mean that the price breaks through a certain trendline. In this context, "breaking the trend" means confirming on our trading timeframe (M15 or H1) that price has formed a clear directional trend—up or down—rather than oscillating in a sideways range. Judgment methods include the HH/HL structure, MA alignment, and the relative position of price to the moving averages.
Do not enter before confirming the trend. This is the first safety valve of the entire system.
"Trust the Trend, your friend."
The trend is our best friend. Going against the trend is like fighting the waves on a beach—the loser is always you.
Step Two: Pullback

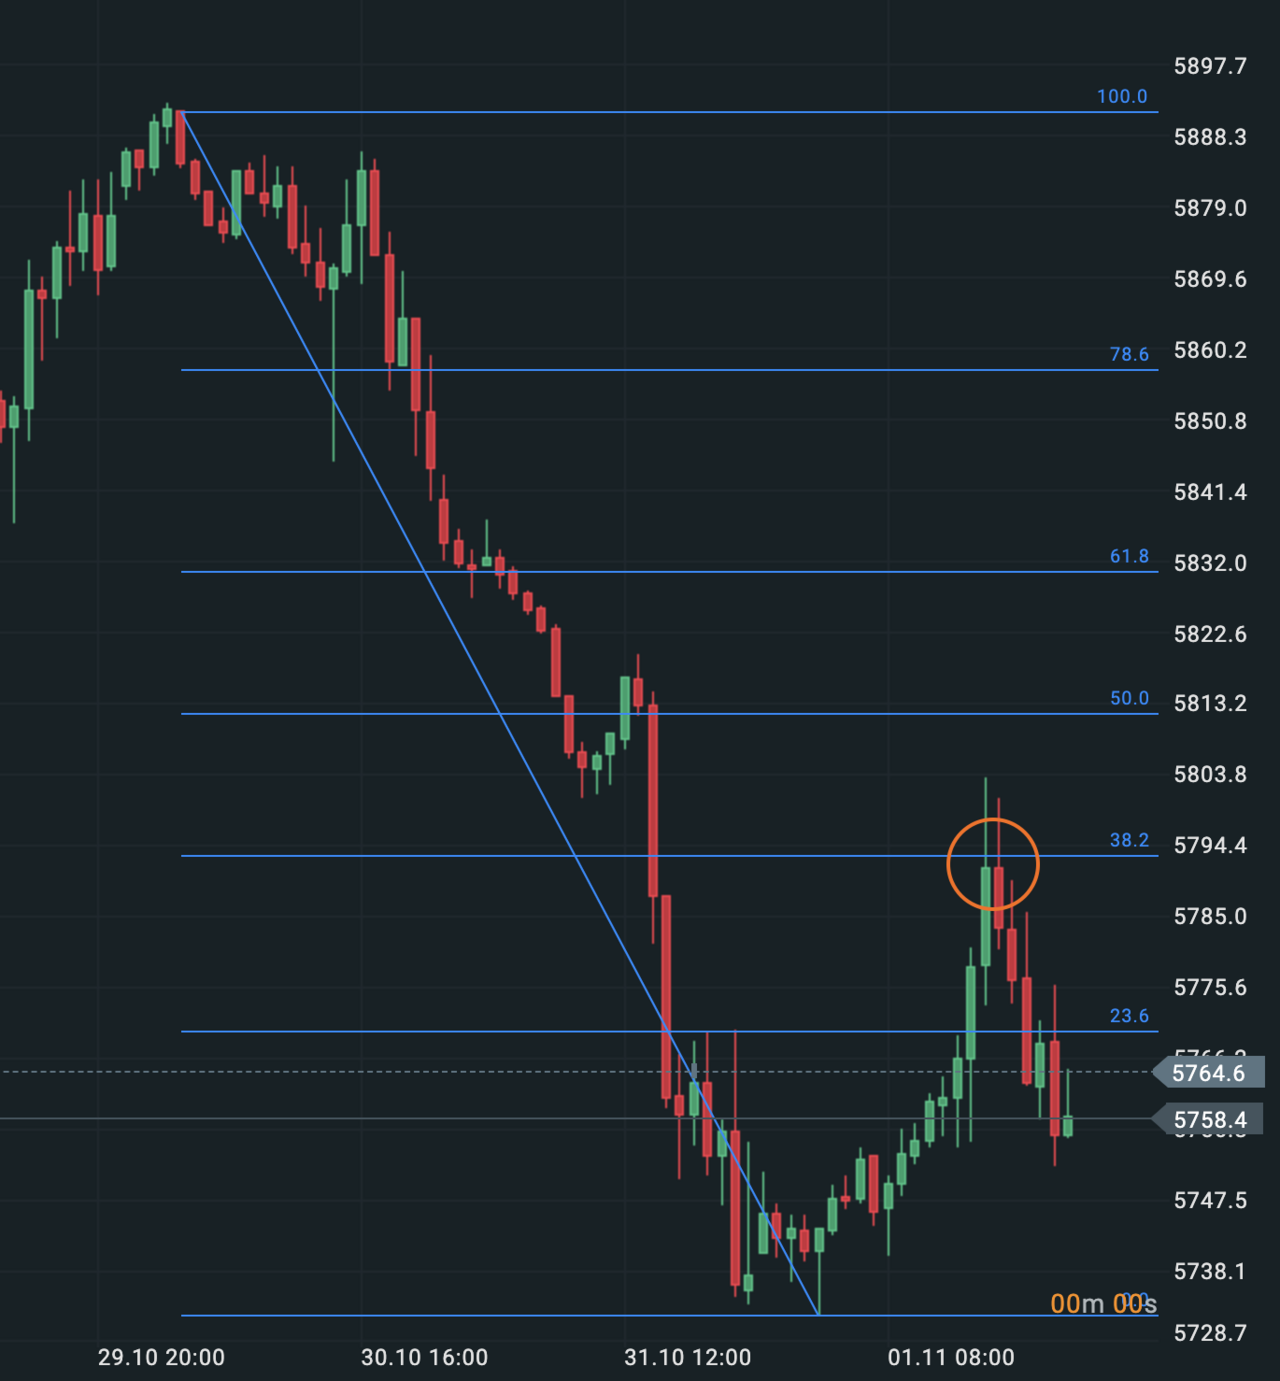
*Fibonacci and moving average reference at a Pullback entry.*
After confirming the trend, wait for price to retrace to a key level (MA, Fib 0.618, trendline, etc.). The art of the Pullback lies in "waiting"—let the market give you a more reasonable entry point rather than chasing price as it runs.
"PB ~ 0.618, the trend may continue; PB ~ 1, a range may emerge."
A retracement close to 0.618 (the golden ratio) signals that the trend may continue; a retracement close to 1.0 suggests the market may enter consolidation.
Fibonacci Retracement Ratios
The most commonly used Fibonacci retracement ratios are 0.382, 0.5, 0.618, 0.786, and each carries a different market meaning.
0.382 (38.2%) represents a shallow pullback, typically appearing in strong trends. It shows the market is extremely bullish, with buyers rushing in even after a minor dip.
0.5 (50%) is a psychological threshold. When the retracement reaches halfway, market sentiment is usually at its most divided. This level is an important observation zone: if price stabilizes here and resumes its original direction, the risk-to-reward ratio for entry is at its best.
0.618 (61.8%) — the Golden Ratio is the retracement level this system values most. A retracement reaching 61.8% while still holding implies the original trend remains valid—this is the sweet spot for entry.
0.786 (78.6%) is the warning line for deep pullbacks. If price pulls back to this level, the probability of trend continuation has dropped sharply, and the market may be brewing a reversal.
Moving Averages as Pullback Support
Beyond Fibonacci ratios, moving averages themselves are an important reference for pullback entries.
MA20 (the 20-period simple moving average) holds a special place. It is more stable than MA10 but more sensitive than MA50, making it the preferred moving average for many traders to confirm Pullback positions on the M15 or H1 chart.
MA50, on the other hand, is suited for stronger support judgment. When price finds support at MA50, it often signals that the medium-term trend remains intact.
"Wait for it to come back to the MA first."
The meaning is clear: never consider an entry before price retraces to the moving average. This kind of discipline is the easiest for beginners to ignore—seeing an "opportunity," they fear missing out and end up chasing the highs.
Step Three: Hold
After price returns to a support level or trendline, confirm that the level is valid. Confirmation methods include a wick closing back inside (Wick), an Engulfing pattern, and price reclaiming position above the MA.
If it "breaks," stand aside or stop out; if it "holds," that is the entry signal.
The Art of Wick Closures
The wick is the upper or lower shadow of a candlestick, representing price's probe in that direction. A long upper wick indicates price probed higher and then pulled back—a sell signal. A long lower wick indicates price probed lower and then bounced—a buy signal.
A "wick closure" means the wick closes back inside the support/resistance level, signaling that the level is valid. Why is a "wick closure" so important? Because it reveals the true supply and demand of the market: when price attempts to break below support but ultimately closes back above it, real buying interest exists at that price level—bears are willing to take delivery here, and the strength of the sellers has been exhausted.
"Wait for the wick to close; then chase the sell below the wick low."
In practice, the ideal entry point is: price probes support, prints a lower wick, and a second candlestick confirms the reversal—only then consider going long with the trend.
The Engulfing Pattern
Engulfing is one of the most important reversal patterns this system uses to confirm "hold." The current candle fully engulfs the previous one, representing a sharp reversal in market sentiment.
In practice, the attitude toward Engulfing is highly cautious—Engulfing must be combined with the first three steps of the slogan to be valid:
"Engulfing at the Trend, pressing back below the 10/20MA."
In other words: the Engulfing pattern, combined with "breaking the trend" (price trading below the MA) and "hold" (an engulfing reversal near the MA), forms a complete slogan-based entry.
"Engulfing gives courage."
This vividly captures the psychological role Engulfing plays in practice: when the pattern you've long awaited finally appears, that confirmation gives you the courage and confidence to enter.
"It Engulfed directly—couldn't keep up."
This means that sometimes the market moves too fast; after the pattern appears, there is no pullback for you to confirm. At that moment, discipline matters more than skill—missed is missed; don't chase.
Step Four: Enter
Once the previous three conditions are confirmed, execute the entry. Set the SL and TP, then let it run. Do not adjust the stop-loss mid-trade, and do not close early because of back-and-forth price action. Once the trade begins, let the market decide the outcome.
The Complete Entry Decision Tree
Step One: Break the Trend
- Is the HH/HL structure in place?
- Is price trading above or below the MA?
- Does the higher timeframe direction agree?
Step Two: Pullback
- Has the retracement reached the 0.382 / 0.5 / 0.618 level?
- Has price returned to the MA20 or MA50?
- Is the pullback duration reasonable?
Step Three: Hold
- Did a wick closure appear?
- Did an Engulfing pattern appear?
- Has price reclaimed stable footing at the support?
Step Four: Enter
- Set SL and TP simultaneously with entry
- Execute strictly; do not modify mid-trade
- Trailing stop gradually tightens as price develops
Why Are These Four Steps Indispensable?
Every step of the four-step method acts as an independent filter; all must be satisfied to enter. If any one fails, you must wait.
- Skip "Break the Trend" → chasing rallies and selling dips in a choppy market
- Skip "Pullback" → buying at the tail end of a trend, only to be swept out by the retracement
- Skip "Hold" → discovering after entry that support has already broken, with a wider stop-loss
- Skip "Enter" → crafting a perfect trade plan but lacking the courage to execute it
These four steps are not suggestions; they are discipline. Missing any one increases the randomness of the trade.
Common Pitfalls
1. Turning "Enter" into "Rush"
Many people, upon seeing a signal, rush to enter before "hold" has been confirmed. "Enter" means execution, not "charge."
2. Skipping "Pullback" and Chasing Price Directly
The most common beginner mistake: seeing that the trend has already formed, jumping in immediately. Waiting for a pullback is the only way to control your entry cost at a reasonable level.
3. Treating "Hold" as "Already Broken"
Pattern confirmation takes time. If you see a single candlestick and assume "hold" has already been established, you may misjudge the trend. Waiting for the candle to close, and waiting for a second candle to confirm, is the more prudent approach.
4. Waiting for a 100% Retracement Before Entering
Some traders are overly conservative and insist on seeing a 100% retracement before feeling "safe." But in reality, a PB ~ 1.0 already signals that the trend may be shifting; the market may be entering consolidation.
5. Expecting Deep Pullbacks in Strong Trends
Strong trends often retrace only shallowly (sometimes ending at 0.382). If you stubbornly wait for 0.618, you may miss a large number of valid entry opportunities.
6. Treating Every Pullback as an Entry Point
Not every pullback is worth taking. You need to combine market structure, support strength, and trend strength in your judgment. If there is no clear support level, do not force an entry.
The "Wait" of the Pullback
The Pullback is an art of "waiting." Waiting for what? Waiting for price to return to a key support zone, waiting for the moving average to catch up to price, waiting for the market to give you a better entry.
"The Trend might reach 1.0 / 1.618 / 2.618—but nobody knows."
Since no one can predict how far price will run, the only thing you can be certain of is that your entry cost on the retracement must be reasonable enough.
How to Judge Whether a Pullback Has Ended?
Confirming the end of a Pullback requires combining several dimensions:
- Price location: Has it reached Fibonacci or moving-average support?
- Candle pattern: Has a lower wick or reversal pattern appeared?
- Time cycle: Is the retracement duration reasonable (too long may signal a trend change)?
- Volume: Is the pullback accompanied by shrinking volume?
When these four dimensions all point to "the Pullback is about to end," it is time to prepare for entry. But the entry action must come after "hold" is confirmed, not on speculation.
Chapter Summary
The four-step method is not designed to make you "earn more," but to make you "lose less." Over the long run, controlling losses matters more than chasing windfall profits. A simple, executable, repeatedly verified framework of discipline is a trader's most valuable asset.
The Pullback is the step that demands the most "patience" within the four-step method. Waiting for price to come home is not passive observation, but active filtering—only strong trends paired with healthy pullbacks are worth entering. Fibonacci and moving averages are the two main tools for judging whether a Pullback has reached its level. Combining these two tools allows you to enter the market at the right moment and at a reasonable price.
⚠️ Disclaimer: This article is for educational purposes only and does not constitute investment advice. Investing involves risk.