Mid-Term Position Trade Strategy
How to use this page: Review before a trade → see the "Quick Decision Table". After every trade → see the "6-Layer Buying Framework". Review mistakes → see "Common Mistakes and Countermeasures".
A · Visual Quick Reference
A1 · Strategy Positioning at a Glance
| Aspect | Mid-Term Position Trade |
|---|
| Trading Style | Hold for weeks to months, trend-following |
| Target Type | Primarily growth stocks, supplemented by ETFs |
| Frequency | Moderate — concentrated around intermediate-term trend strength and weakness in the broader market |
| vs. Short-Term | More conservative, mostly large-cap names |
| When Wrong | Stop out quickly |
| When Right | Hold for longer to capture the full major move |
| Main Source of Profits | A small number of large winning trades lift overall performance |
| Core Principle | Preserve capital first, then pursue profit; capital protection comes first |
A2 · Risk Math — Why 0.5%?
🧮 Core Formula: Position Size × Stop-Loss Range = Damage to Capital from the Stop-Loss
| Scenario | Position / Stop-Loss | Damage to Capital |
|---|
| Standard Position | 5% of capital × 8% stop-loss | 0.4% of capital |
| Test the Waters | 2.5% of capital × 8% stop-loss | 0.2% of capital |
| Tailwind Add-on | 10% of capital × 5% stop-loss | 0.5% of capital |
| 10 Consecutive Stop-Losses | — | Only -5% of capital (easy to recover) |
✅ Interpretation: The 0.5% per-trade cap means that even 10 consecutive stop-losses only cost you -5% of capital — a drawdown that is not difficult to recover. In the testing-the-waters phase, keep damage to 0.2–0.3%, then scale up to 0.5% after successfully building a profit cushion.
A3 · Position Sizing Decision Flow
🟢 1️⃣ Base Position → 5% of capital (especially recommended for those with < 5 years of experience)
🟢 2️⃣ Testing the Waters Phase → 2.5% of capital, stop-loss damage 0.2–0.3%
🟢 3️⃣ Profit Cushion Successfully Built → Scale to 5% of capital, stop-loss damage 0.5%
🟢 4️⃣ Best Opportunity of the Year → Single position up to 10% of capital
🟢 5️⃣ Breakout Advances 2–3% Smoothly → Consider adding 2.5%–5% of capital
� 6️⃣ Market Weakens / Index Drops Below 50MA → Reduce entry capital to 25% or lower
A4 · Three-Layer Stop-Loss Design
| Layer | Rule | Purpose |
|---|
| 🛑 Hard Stop-Loss | Must sell at -7–8% from entry, no exceptions | Prevent a single loss from dragging up the average |
| 📉 Tighten on Market Weakness | When the index enters correction, tighten stop-loss to 3–5% | Shorten exposure time in a weak environment |
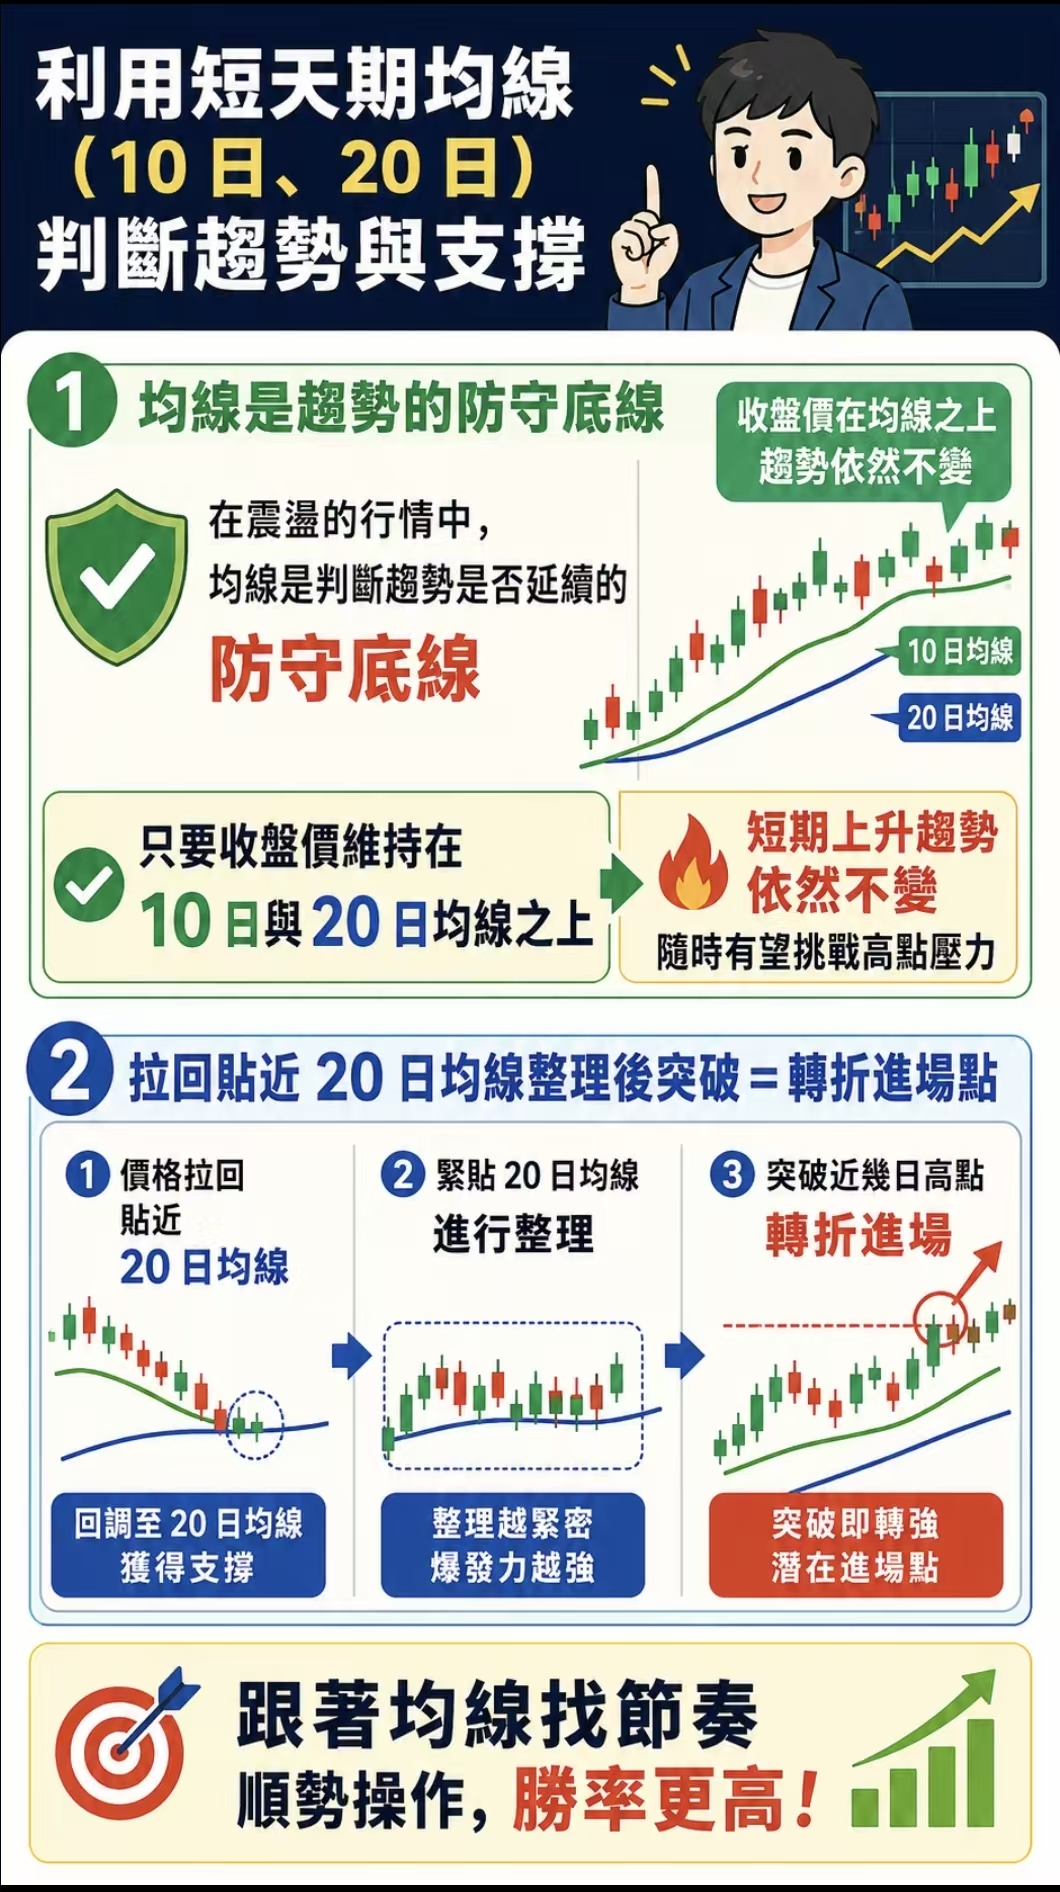
| 📊 Staged Stop-Loss (Example) | Below 20-day line, cut 1/2 or 1/3 first; below 50-day line or -8%, exit all | Discipline + give the trend some room |
A5 · 6-Layer Buying Framework
Filter sequentially; if any layer fails, abandon the candidate.
🌦️ Layer 1 · 🌦️ Market Environment Filter → 75% of stocks follow the index — first check whether the macro environment allows aggressive operation
📈 Layer 2 · 📈 Long-Term Uptrend → 200-day MA turning up = Stage 2 trend-following
💪 Layer 3 · 💪 Stock Relative Strength → Stock clearly stronger than the index and its peers; near 52-week highs
🏭 Layer 4 · 🏭 Industry Relative Strength → First pick the strongest industry (e.g., semiconductors), then the stock
🎯 Layer 5 · 🎯 Price Pattern Turning Point → VCP / Cup-and-Handle / Double Bottom / Flat Base — enter within 1% of the breakout
📊 Layer 6 · � Fundamentals Filter (Bonus) → Quarterly growth > 20%; 3 consecutive quarters > 20% is excellent
A6 · Market Environment Assessment
| Market Signal | Corresponding Action |
|---|
| Index 10/20MA both pointing up | Breakout trades have better win rate and risk-reward |
| Index corrects for 2 months then reclaims 20MA | Treat as a testing-the-waters signal; entry capital ≤ 25% |
| Index breaks out of a major base or long-term trend line | Market clearly improving; can increase exposure |
| 4–5 distribution days accumulated within 25 days | The most reliable leading indicator of a market top |
| Index drops below the 50-day MA | Entry capital reduced to 25% or lower |
| New highs < New lows | Caution period; a few large caps holding up is not stable enough |
A7 · Total Exposure — Adjust With Market Conditions
| Market Condition | Total Exposure |
|---|
| Bullish environment (Index 10/20MA up) | Can increase to 60% – 100% |
| Suspected weakness or correction | Reduce to 25% or lower |
| Unclear market | Holding 50% – 75% cash is the right choice |
| Bear market / Intermediate correction | Don't force entries; cash is also a position |
A8 · 6-Layer Stock Selection Filter (Top-Down)
🟢 Decision Flow: Filter top-down, layer by layer. If any layer FAILS, abandon the candidate — do not proceed.
- 🌦️ Layer 1: Is the market suitable for breakout trades? (Index 10/20MA up = YES)
- 📈 Layer 2: Is the stock in a long-term uptrend? (200MA rising = YES)
- 💪 Layer 3: Is the stock's RS clearly stronger than the market? (Near 52-week high = YES)
- 🏭 Layer 4: Is its industry a leading group? (Industry RS high = YES)
- 🎯 Layer 5: Has a VCP / Cup-and-Handle / Double Bottom pattern formed? (Consolidation complete = YES)
- 📊 Layer 6: Do fundamentals support it? (Quarterly growth > 20% = bonus, not required)
A9 · Selling Methods — Three Scenario Decisions
| Scenario | Rule | Trigger Action |
|---|
| 🛡️ Weakness Exit (Trailing Stop) | Mid-term uses 50MA as the pivot; oscillating markets use 20MA | Break below → Sell |
| 🎯 Offensive Exit (Profit-Taking) | 20–25% rule: after 20–25% gain, on a pullback → sell at least 1/3–1/2 | Profit reaches 20% range → Scale out |
| 🚨 Climax Run Exit | Surges 25–50% in a short period, extreme volume, gaps, price-volume divergence | Sell most of the position |
⚡ 8-Week Holding Rule Exception: If a stock rallies 20%+ within 3 weeks, this is an extremely strong signal — hold for at least 8 weeks before reassessing. Hyper-growth names with quarterly profit growth > 100% and accelerating can be held longer.
A10 · Concentration Limits
| Rule | Limit |
|---|
| Single position | No more than 15% of account capital |
| Single industry | No more than 25% of capital |
| Highly correlated names combined | Avoid duplicate exposure to the same thesis |
A11 · Common Mistakes and Countermeasures
❌ Mistake 1: Not Stopping Out / Hoping Losses Will Recover on Their Own
✅ Make "Was the stop-loss executed?" the top self-evaluation metric. You can use staged stop-losses: -3% sell 1/3, -5% sell 1/3, -8% sell the rest.
❌ Mistake 2: Falling in Love with the Stock / Overconfidence in Fundamentals
✅ The 8% hard stop-loss does not change. The stock price leads fundamentals by 3–6 months — don't wait for the earnings report.
❌ Mistake 3: No Trading Journal or Regular Review
✅ Record each trade: entry reason, buy price, stop price, exit price, P/L, post-mortem. Focus on "Did I execute the plan?".
❌ Mistake 4: Over-Concentration / Going All-In on One or Two Names
✅ Set hard limits: "No single position > 15%", "No single industry > 25%".
❌ Mistake 5: Ignoring the Market Context, Forcing Trades in a Bear Market
✅ Index drops below 50MA → reduce exposure. Cash is also a position; experts know how to "wait".
A12 · Regime Triggers
When any of the following triggers activate, switch to the corresponding position strategy:
| Trigger Condition | Action |
|---|
| Index 10MA and 20MA both pointing up | Can aggressively look for breakouts; total exposure 60–100% |
| Index drops below 50MA | Total exposure reduced to ≤ 25%; preserve flexibility |
| ≥ 4 distribution days within 25 days | Treat as a leading indicator of a market top; trim across the board |
| Individual stock -3% from entry | Cut 1/3 of position (staged stop-loss) |
| Individual stock -5% from entry | Cut another 1/3 |
| Individual stock -8% from entry | Exit all |