
Using VWAP to Spot Day Trade Opportunities
A practical guide showing how day traders use VWAP with the 10MA and 20MA plus simple candlestick patterns to find high-probability entries in XAUUSD, with clear risk rules.
Using VWAP to Spot Day Trade Opportunities
Day trading has one annoying problem: guessing tops and bottoms. New traders often jump in on instinct and end up buying the high and selling the low. VWAP (Volume-Weighted Average Price) solves exactly this. It combines price and volume into a single line that represents the average cost of every participant in the market so far today. For short-term traders, VWAP is one of the most important bull/bear dividing lines on the chart.
What Is VWAP?
In plain English, VWAP is the average price actually paid for each dollar traded up to now. It is calculated by adding up (price × volume) for every trade and dividing by total volume.
It has three defining traits:
- It resets every day — VWAP starts fresh at the open, with no contamination from prior days.
- It acts as dynamic support/resistance — price above VWAP means buyers control the session; price below means sellers do.
- Institutions use it to judge execution quality — so institutional traders pay close attention to it.
The rule of thumb is simple: think long only above VWAP, short only below VWAP.

Why Combine VWAP With the 10MA and 20MA?
VWAP alone gets faked out in choppy markets, so traders pair it with two moving averages:
- 10MA (10-period moving average) — captures short-term rhythm; price above it means near-term strength.
- 20MA (20-period moving average) — captures the medium-term trend; you only trade with the 20MA, not against it.
Each line has a clear job:
| Line | Role | How To Use It |
|---|---|---|
| VWAP | Session bull/bear divider | Above = long bias, below = short bias |
| 10MA | Short-term momentum | Stay out when broken, hold when intact |
| 20MA | Trend filter | Highest win rate when trading with 20MA |
When all three lines stack the same way, e.g. price > VWAP > 10MA > 20MA, you have the cleanest bullish alignment and the highest probability long setup. The inverse gives you the cleanest bearish alignment.
XAUUSD in Practice: A Gold Example
Gold (XAUUSD) has excellent liquidity and big moves, making it a favorite day-trading instrument. Using a 15-minute chart, the workflow looks like this:
Step 1: Identify the Trend Direction
Open the 1-hour chart first. Check whether the 20MA is sloping up or down. Only trade in the direction of the 20MA — long setups when it slopes up, short setups when it slopes down. This single filter removes roughly half of all bad signals.
Step 2: Switch to 15 Minutes for Entries
Move to the 15-minute chart and wait for two conditions to appear at the same time:
- Price pulls back to VWAP but does not break it (look for a candle with a long lower wick).
- A reversal candlestick pattern forms, such as a Hammer, Bullish Engulfing, or Morning Star.
When both conditions line up, you have a triple filter: trend-aligned, VWAP-aligned, and pattern-confirmed.
Step 3: Define Stop-Loss and Targets
- Entry: open of the next candle after the reversal candle closes.
- Stop-loss: 2–3 dollars below the low of the reversal candle (XAUUSD has wide spreads, give it room).
- Target 1: previous swing high (1:1 risk-reward).
- Target 2: 1.5× ATR above VWAP for the day.
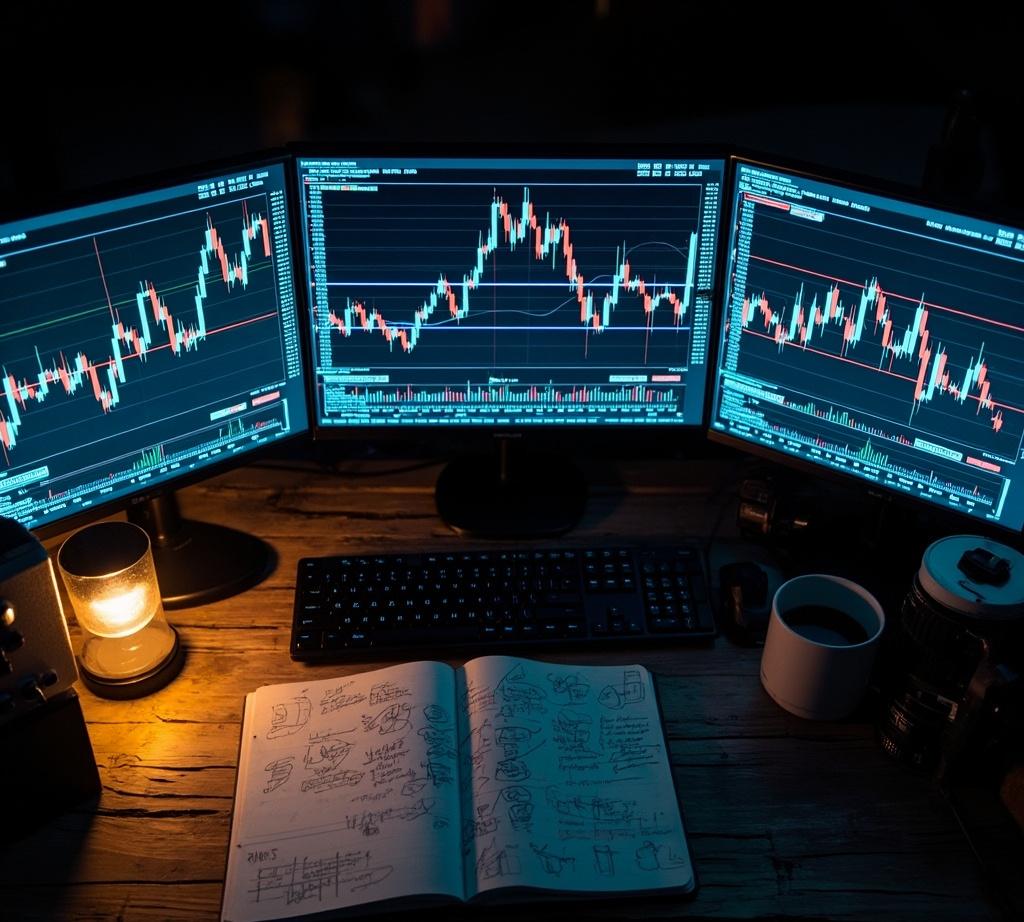
Three Real Scenarios
Scenario A: Trend Pullback to VWAP (Highest Win Rate)
Gold pushes higher during the session and stays above VWAP. Suddenly a big 15-minute bearish candle drags price back into VWAP but fails to close below it and leaves a long lower wick. This is the textbook "trend pullback to VWAP."
How to trade it: if the next candle reclaims VWAP, go long and place your stop just below that wick's low.
Scenario B: Failed Bounce After a VWAP Break
Price breaks below VWAP, the 10MA, and the 20MA. The three lines stack bearish. A later bounce tags VWAP from below but cannot break it and prints a long upper wick. That is the textbook "bounce-into-VWAP-to-short" setup.
How to trade it: short at VWAP on a bearish reversal candle, with the stop 3 dollars above VWAP.
Scenario C: Flat Means Don't Trade
When the 10MA and 20MA tangle together and VWAP is almost flat, the day has no direction. Skip it. Many traders bleed money refusing to sit out boring sessions.
Three Common Mistakes
- Treating VWAP like any other moving average. It is volume-weighted, not just price-weighted, so its signals differ from EMA and SMA logic.
- Forcing trades in chop. Without a trend, VWAP gets crossed back and forth and stops you out repeatedly.
- Ignoring the higher timeframe. Trading only on the 5-minute chart without checking the 1-hour or daily trend is like feeling an elephant's tail and trying to describe the whole animal.
When Does This Method Fail?
- Major data releases. Around 30 minutes before and after US Non-Farm Payrolls or CPI, volatility temporarily breaks VWAP signals.
- Low-liquidity Asian session. XAUUSD often prints fake breakouts during Asian hours, and VWAP signals get distorted.
- Trend reversal days. When the 1-hour 20MA flips direction, the "trade with the trend" rule must flip immediately.
In all three cases, the safest move is to step aside and wait for the next clean signal.

Closing Thoughts
VWAP is not magic, but it gives day traders the cleanest bull/bear divider on the chart. Pair it with the 10MA for short-term rhythm, the 20MA for the medium-term trend, and a candlestick pattern for entry confirmation, and you have a repeatable, disciplined system.
Three takeaways to remember:
- Trade with the higher-timeframe trend (the 20MA).
- Trade with VWAP direction and wait for pullbacks for entries.
- No signal, no trade — protecting capital matters more than being in the market.
⚠️ Disclaimer: This article is for educational purposes only and does not constitute investment advice. Investing involves risk.