
How to Use AI for Stock Trading? A Complete Roadmap from Concept to Live Trading
AI-driven stock trading is no longer science fiction—it is already happening. This article breaks down the practical applications of AI in stock trading, from data collection, feature engineering, and model training to live deployment, helping you avoid the most common pitfalls.
AI Stock Trading: Truth vs Fantasy
Let's be clear about one thing upfront: AI won't help you "earn money while lying flat."
99% of products on the market that boast "AI auto-trading earns 30% per month" are scams. Real AI trading involves massive data processing, feature engineering, model training, and — most importantly — strict risk management.
But here is what AI can actually do:
- Process massive volumes of data that the human brain cannot digest
- Discover price patterns invisible to the human eye
- Monitor the market around the clock without interruption
- Eliminate the influence of emotions on trading decisions
- Automatically execute predefined trading strategies
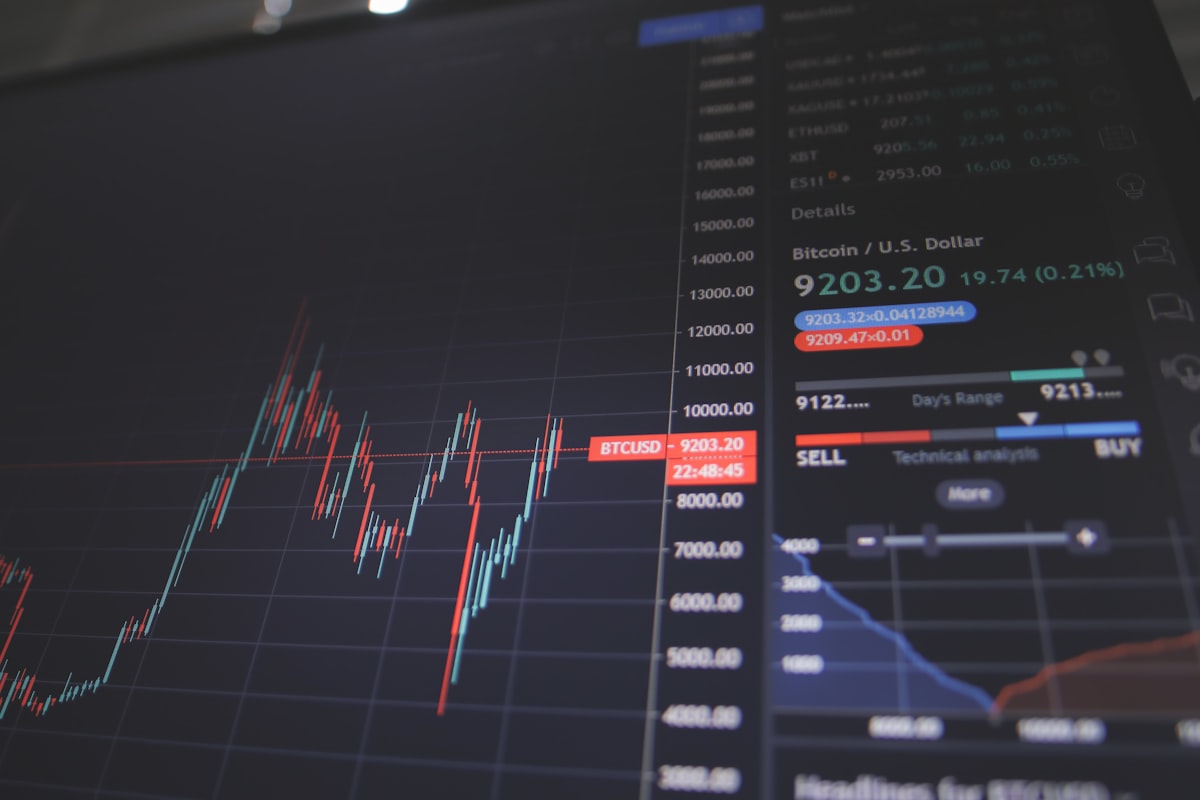
*AI's advantage isn't "being smarter" but "being faster, cooler, and tireless."*
The Four Levels of AI Stock Trading
Level 1: AI-Assisted Analysis (The Most Practical)
This is the level most people can start using right away:
- Natural Language Processing (NLP): Use LLMs (such as GPT, GLM) to analyze financial reports, news, and central bank statements, and quickly extract key information
- Sentiment Analysis: Scan Twitter, Reddit, and financial forums to quantify whether market sentiment is bullish or bearish
- Smart Stock Screening: Use AI to filter stocks that meet specific criteria (for example, "revenue growth for 4 consecutive quarters + gross margin > 30% + RSI < 40")
- Chart Pattern Recognition: Use computer vision to automatically identify candlestick patterns, support/resistance levels, and trend lines
Who It's For: All investors. You don't need to write code — ChatGPT or a dedicated AI tool will do the job.
Level 2: Quantitative Strategy Backtesting (Introductory Programming)
Use Python + historical data to validate your trading ideas:
Common Tools:
├── yfinance / CCXT (data acquisition)
├── pandas / numpy (data processing)
├── backtrader / vectorbt (backtesting frameworks)
├── ta-lib / pandas-ta (technical indicators)
└── matplotlib / plotly (visualization)
Typical workflow:
- Define the strategy rules (for example, "buy when MA20 crosses above MA50; sell when it crosses below")
- Pull the past 5–10 years of historical data
- Use a backtesting framework to simulate trades and calculate returns, maximum drawdown, and Sharpe ratio
- Optimize parameters — but beware of overfitting
The Biggest Trap: Good backtest performance ≠ profits in live trading. Overfitting, ignoring transaction costs, and survivorship bias — these three pitfalls can bankrupt your "perfect strategy" in live trading.
Level 3: Machine Learning Prediction Models (Advanced)
Use ML models to predict price direction or volatility:
| Model | Use Case | Strengths | Limitations |
|---|---|---|---|
| XGBoost / LightGBM | Classification (up/down), regression | Fast, stable, interpretable | Hard to capture temporal dependencies |
| LSTM / GRU | Time-series prediction | Captures long-term dependencies | Slow to train, prone to overfitting |
| Transformer | Multi-factor sequence prediction | Strongest sequence modeling capability | Requires large data and compute |
| Reinforcement Learning (RL) | Dynamic decisions (buy/sell/hold) | Autonomously learns the optimal strategy | Low sample efficiency, hard to design the reward function |
| Ensemble Models | Combine multiple models | Reduces single-model risk | High complexity |
Key steps:
- Feature Engineering — this is 10 times more important than model selection
- Price features: returns, volatility, momentum
- Volume features: turnover rate, price-volume divergence
- Cross-asset features: correlations, sector rotation
- Macro features: interest rates, exchange rates, VIX
- Sentiment features: news sentiment scores, social media heat
- Cross-validation — don't use random splits; use Time Series Split
- Training set: 2018–2022
- Validation set: 2023
- Test set: 2024–2025
- Always use only past data to predict the future
- Feature Selection — less is more
- Use SHAP values or Mutual Information to filter down to the 10–20 most important features
- Redundant features only add noise and overfitting risk
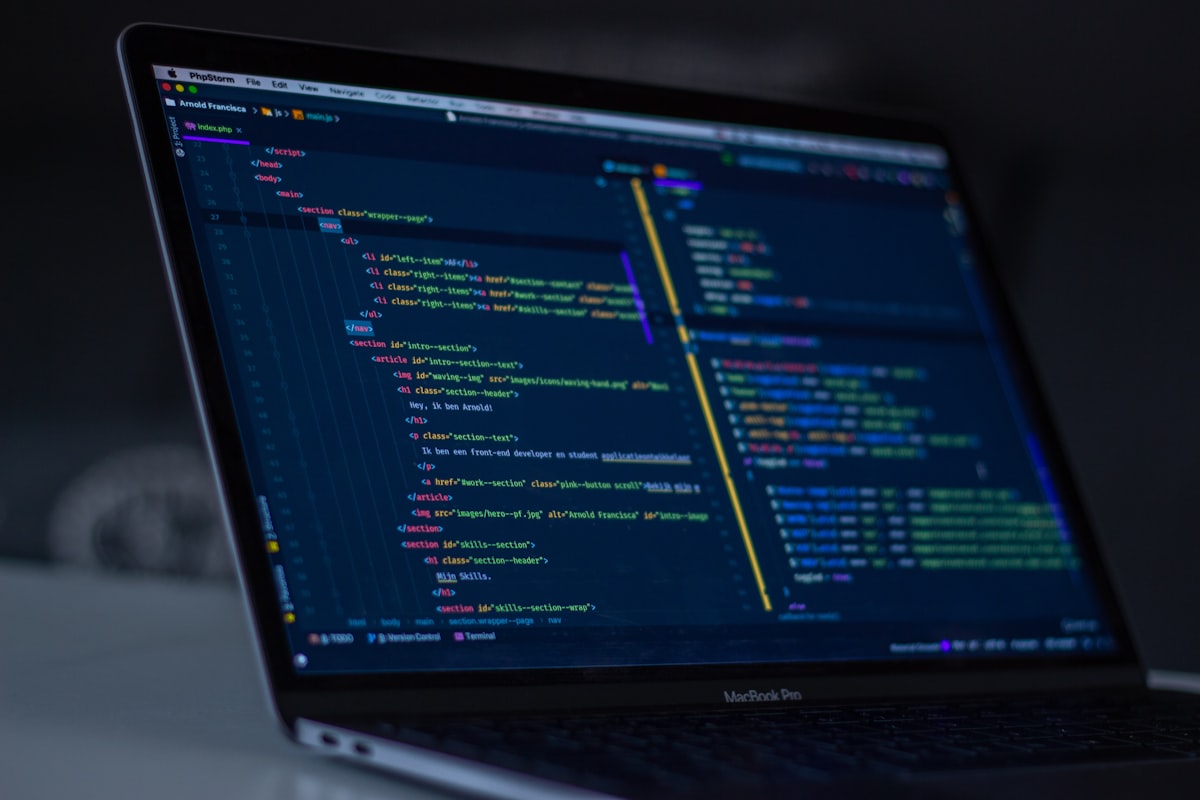
*Code is the language of AI trading — every line embodies a strategic hypothesis, and every backtest is a question posed to the market.*
Level 4: Fully Automated AI Trading System (The Most Complex)
Connect AI models to actual trading infrastructure:
Data Pipeline → Feature Calculation → Model Prediction → Signal Generation → Risk Check → Order Execution → Position Monitoring
    ↑                                                                              |
    └─────────────────── Logs + Performance Analysis ←────────────────────────────┘
Tech stack:
- Data: WebSocket real-time market data, Finnhub / Alpha Vantage API
- Compute: Redis (caching), Celery (async tasks)
- Trading: Futu OpenD, Interactive Brokers API, MetaTrader 5
- Monitoring: Grafana + Prometheus, Telegram Bot alerts
- Deployment: Docker + AWS / Google Cloud
Warning: This level requires 6–12 months of development, and even after going live it still needs ongoing monitoring and optimization. An AI trading system is not "set it once and run forever" — shifts in the market environment will cause models to失效.
Specific Uses of LLMs in Trading
By 2025–2026, Large Language Models (LLMs) have become powerful enough to play a meaningful role in trading:
1. Financial Report Interpretation
Feed 10-K and 10-Q filings, along with earnings call transcripts, to an LLM and ask it to:
- Extract changes in core financial metrics
- Compare management guidance with actual results
- Identify questions that management dodged
- Judge whether the tone is confident or cautious
2. Pricing News Events
"Fed Chair Warsh used the word 'persistent' three times at the FOMC press conference" — LLMs can instantly analyze this statement's hawkish/dovish tilt and combine it with historical data to estimate the market impact.
3. Strategy Code Generation
Describe your strategy in natural language and the LLM will generate Python code for you. For example:
"Write a strategy: when the S&P 500's 20-day moving average crosses above the 50-day moving average, and RSI < 70, buy SPY; when the 20-day moving average crosses below the 50-day moving average, sell. Stop-loss 5%, take-profit 15%."
LLMs can produce a complete backtest-ready script in seconds.
4. Market Commentary Generation
LLMs can automatically generate daily market summaries, portfolio analysis reports, and risk alerts, saving a huge amount of manual work.
The 5 Most Common Pitfalls
Pitfall 1: Overfitting
Your model performs perfectly on historical data — but the moment it goes live, it starts losing money.
Solutions:
- Use Walk-Forward Analysis (rolling window validation)
- Limit model complexity (fewer parameters > more parameters)
- Use out-of-sample data for final validation
Pitfall 2: Ignoring Transaction Costs
The backtest doesn't account for commissions, slippage, or market impact costs. High-frequency strategies are especially sensitive — theoretically you earn 0.1%, but actual costs eat up 0.15%, so every trade loses money.
Solution: Bake a conservative transaction-cost assumption into every backtest (at least 0.1% per round trip).
Pitfall 3: Data Leakage
Using "future data" to make "past predictions." For example, normalizing the entire dataset at once, then "predicting" data in the backtest that has already been contaminated by future information.
Solution: Every feature engineering step must use only data available up to that point in time. Use an Expanding Window for normalization.
Pitfall 4: Model Drift
Market conditions change and models that used to work stop working. A model trained in 2020 may be completely useless in 2026.
Solution: Retrain regularly (monthly/quarterly), monitor prediction accuracy, and set up an automatic degradation mechanism (automatically reduce position sizes when model performance deteriorates).
Pitfall 5: Black Swan Events
AI models are trained on historical data, so extreme events they've never seen before (such as the March 2020 pandemic crash) will cause the model to break down completely.
Solution: Always have hard risk-control rules (max daily loss, max drawdown). These rules are not decided by the AI — they are gated by humans.
Beginner's Roadmap
| Stage | Time | Learning Content |
|---|---|---|
| Month 1–2 | Fundamentals | Python + pandas + basic statistics |
| Month 3–4 | Backtesting | yfinance + backtrader + technical indicators |
| Month 5–6 | Machine Learning | scikit-learn + XGBoost + feature engineering |
| Month 7–9 | Deep Learning | PyTorch + LSTM + Transformer basics |
| Month 10–12 | Live Trading | Small-scale live testing + risk-control system setup |
Recommendation: Start with the simplest strategy (for example, a dual moving-average crossover), get the entire pipeline working (data → backtest → live), then add AI elements on top. Don't start by trying to write a Transformer model — you'll have given up by the data-cleaning stage.
Chapter Summary
AI stock trading isn't magic; it's engineering. Its core competitive advantages lie in:
- Data processing capability — a human looks at 5 charts, AI looks at 5,000
- Emotional discipline — AI won't engage in revenge trading after consecutive losses
- Execution speed — from signal to order, at the millisecond level
- Continuous learning — models can be iteratively improved over time
But what ultimately determines success or failure isn't how complex the model is — it's:
- Whether your feature engineering carries real information
- Whether your risk control is strict enough
- Whether your expectations are reasonable (20–30% annualized is already excellent)
- Whether you're willing to continuously iterate, because the market is always changing