How to Draw Support and Resistance Levels: A Complete Guide from Basics to Application
Support and resistance form the foundation of all technical analysis. This article teaches you how to correctly identify, draw, and apply support and resistance levels, avoid common drawing mistakes, and build systematic rules by combining quantitative trading concepts.
?
Among all technical analysis tools, Support and Resistance is the most primitive, most intuitive, and most frequently abused tool. It requires no indicators, no formulas — only your eyes and a straight line.
But precisely because it is so simple, many people draw it wrong. The mistake lies not in the line itself, but in the details of how to define a valid touch and how many touches count.

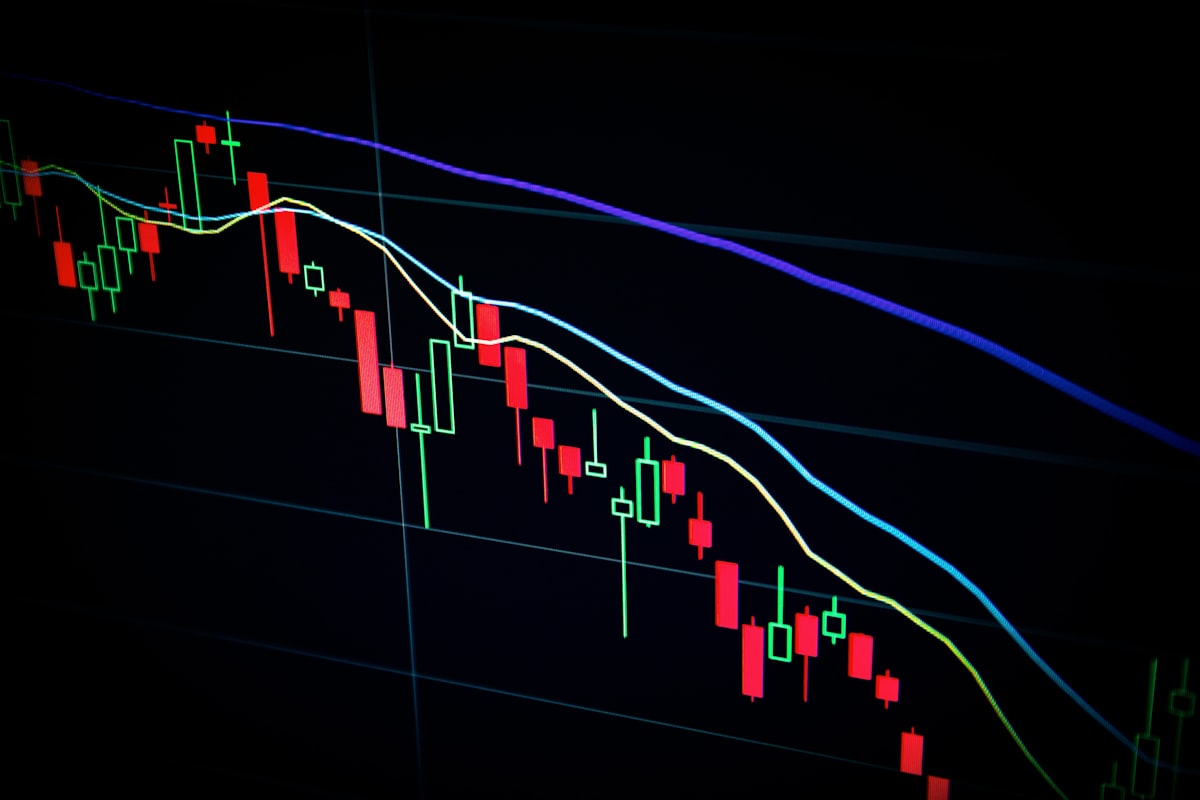
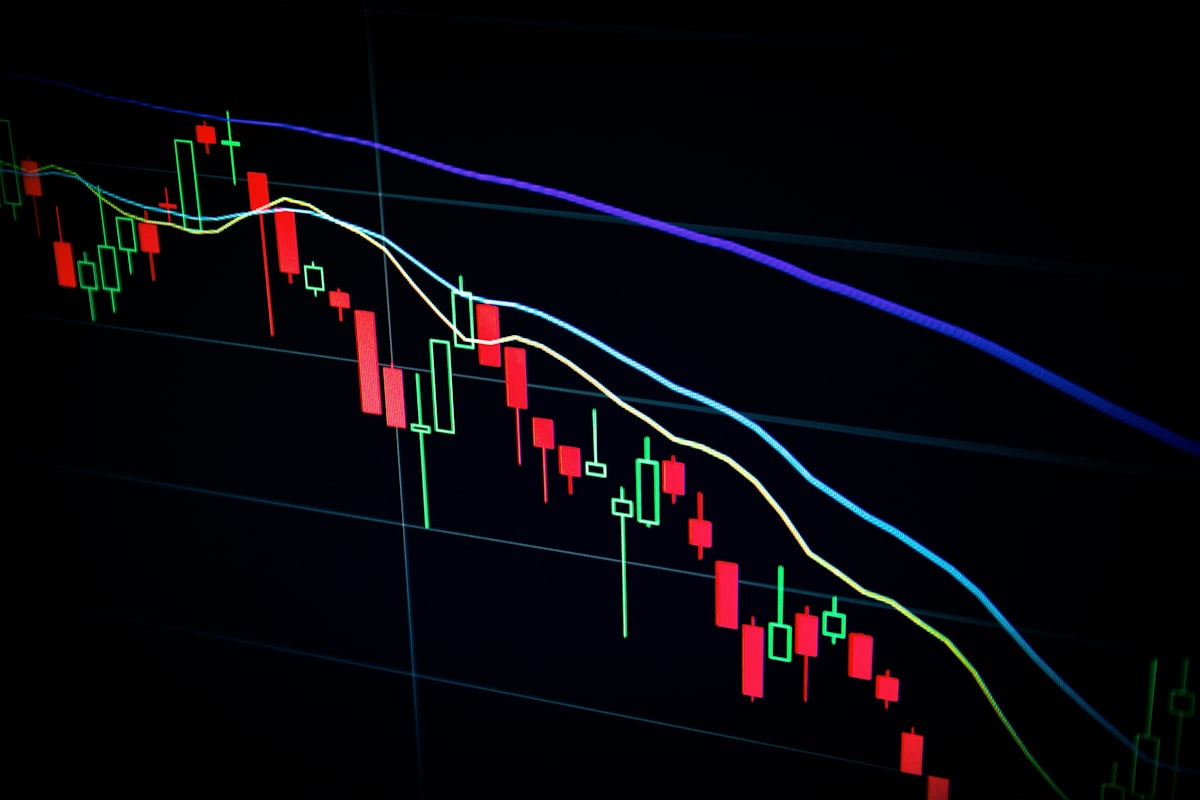
*The starting point of chart analysis — a simple horizontal line may be more valuable than all your indicators combined.*
The Nature of Support and Resistance
Support
Support is the price zone where buying interest steps in as price falls. You can think of it as a "floor" — when price drops to this level, something holds it up.
- Price touches it multiple times without breaking below
- Each touch is followed by a bounce
- Volume clearly expands at this level
Resistance
Resistance is the price zone where selling interest steps in as price rises. The "ceiling" — when price climbs to this level, it gets pushed back down.
- Price touches it multiple times without breaking through
- Each touch is followed by a pullback
- Previous highs, round-number levels, and gap edges all tend to form resistance
Core logic: Support and resistance are not an exact price, but a zone. We describe them with "lines" only for convenience — in reality, they should be understood as "bands."
The Four-Step Drawing Method
Step 1: Switch to a Higher Timeframe
Always start drawing support and resistance from a higher timeframe:
| Timeframe | Use |
|---|---|
| W1 / D1 | Draw the primary support and resistance (most important) |
| H4 | Draw secondary support and resistance |
| H1 / M15 | Draw short-term support and resistance (for precise entries) |
| M5 / M1 | Not recommended — too much noise |
"One D1 support line is worth more than ten M15 lines."
Support and resistance on higher timeframes are formed by larger-scale capital battles and are far more reliable than those on lower timeframes.
Step 2: Find the Obvious Turning Points
On the chart, look for:
- Swing High: the point where price makes a local high and then turns down
- Swing Low: the point where price makes a local low and then bounces
You are not looking for every fluctuation, but for clearly visible, obvious turning points. If you have to zoom in to see a fluctuation, it does not count.
Step 3: Connect at Least Two Touch Points
A valid support/resistance line needs at least two touch points:
- Two touches → preliminary confirmation; draw it but mark it as "to be verified"
- Three touches → valid confirmation; this is a reliable level
- Four or more → strong support/resistance; a break will have a major impact
Note: the longer the interval between touches, the more weight this line carries. A support line spanning three months is far more reliable than one formed over three days.
Step 4: Use Zones, Not Lines

*Wall Street — the center of global capital battles. Support and resistance are the footprints left behind by this capital.*
Do not draw a thin line; draw a zone. The specific approach:
- Find the highest and lowest points of the touch area (including wicks)
- Use these two points to form a "band-shaped zone"
- The width is usually between 0.3% and 1% (depending on the instrument and timeframe)
- When price enters this zone, it is "reaching support/resistance," not "touching a line"
Common Drawing Mistakes
Mistake 1: Forcing Every Swing to Become a Line
Not every Swing High / Swing Low needs a line. Only draw the most obvious turning points that have been tested multiple times. Drawing too many lines only makes it harder to see which ones matter.
Mistake 2: Defining Position with Wick Tips
Many beginners draw lines using the tip of the longest wick. But wicks are often the product of extreme sentiment and lack representativeness. You should use the area where bodies (candle bodies) cluster densely as the core of support and resistance.
Mistake 3: Ignoring Candle Pattern Confirmation
A support/resistance line is only a "zone where reversal may occur," not "a guarantee that reversal will occur." Each time price approaches support or resistance, you must wait for candle pattern confirmation:
| Pattern | Position | Meaning |
|---|---|---|
| Pin Bar / Hammer | At support | Strong reversal signal ✅ |
| Engulfing | At support/resistance | Trend reversal ✅ |
| Doji | At support/resistance | Indecision ⚠️ |
| Long body breakout + no pullback | Above resistance | Breakout confirmed; resistance becomes support ✅ |
| Long wick touch + pullback | Inside support/resistance zone | False breakout ⚠️ |
Mistake 4: Drawing Too Many Lines on Low Timeframes
M5 and M1 support/resistance levels are endless, and most of them are invalid. Always remember: work from high to low — D1 first, H4 next, then M15.
The Role Reversal of Support and Resistance
When a resistance line is decisively broken, it becomes support. Likewise, when support is broken, it becomes resistance. This phenomenon is called Polarity Change.
How to Confirm a Valid Breakout?
- Close price breaks through (not the wick)
- The breakout is accompanied by expanded volume
- The second candle after the breakout does not fall back to the original level
- On the daily chart, price closes above the breakout level for at least two consecutive days
False breakouts are the trader’s greatest enemy. They specifically trigger stop losses at key support/resistance levels, then run in the opposite direction. The best way to defend against false breakouts: wait for the close to confirm.
Support and Resistance in Quantitative Trading
In algorithmic trading, support and resistance can be defined quantitatively, no longer relying on the human eye:
Method 1: Pivot Points
Pivot = (High + Low + Close) / 3
R1 = 2 × Pivot - Low
S1 = 2 × Pivot - High
R2 = Pivot + (High - Low)
S2 = Pivot - (High - Low)
The classic Pivot Points system automatically calculates support and resistance levels for each trading day. It is well suited for day traders who need to locate levels quickly.
Method 2: Swing Detection Algorithm
Use code to find Swing Highs and Swing Lows:
- Set a window size N (for example, 5 candles)
- If a candle’s High is the highest within the window → mark it as a Swing High
- If a candle’s Low is the lowest within the window → mark it as a Swing Low
- Cluster Swing points at similar price levels to form support and resistance zones
Method 3: Volume Profile
The price zone where trading volume is most concentrated = support and resistance formed naturally. Volume Profile is more objective than traditional line-drawing because it directly reflects "where capital is most active."
Method 4: Fibonacci Retracement
Using the high and low of a recent trend as the base, draw multiple support and resistance zones using Fibonacci ratios (23.6%, 38.2%, 50%, 61.8%, 78.6%). Among these, 61.8% (the golden ratio) is the most frequently tested level.
Practical Workflow
Daily Preparation Routine
- Open the D1 chart → draw all major support and resistance levels (5–10 lines)
- Switch to H4 → add secondary levels on top of the D1 foundation
- Switch to M15 → only mark the positions that overlap with D1/H4
- Mark today’s important levels → previous day’s high/low, today’s open, round-number levels
Decision Flow During Trading
Is price approaching a support/resistance zone?
├── Yes → Wait for candle pattern confirmation
│   ├── Reversal pattern appears → consider a counter-trend entry
│   └── Breakout confirmed (close + volume) → consider a trend-following entry
└── No → Take trend-following trades within the space between support and resistance
Chapter Summary
Support and resistance are the foundation of technical analysis. Draw them well, and every trading strategy you build will have a more solid foundation. Remember four principles:
- Higher timeframe first — a D1 line is ten times more important than an M5 line
- Use zones, not lines — support and resistance are areas, not single points
- Wait for confirmation before acting — candle pattern, volume, and close price are all required
- Less is more — five effective lines are better than thirty lines you cannot even read clearly
⚠️ Disclaimer: This article is for educational purposes only and does not constitute investment advice. Investing involves risk.